
Digital 2022: July Global Statshot Report
DataReportal’s new Digital 2022 July Global Statshot Report – published in partnership with We Are Social and Hootsuite – shows that we’re still seeing solid growth in digital adoption and activity around the world.
The data reveal that hundreds of millions of people started using the internet and social media for the first time over the past 12 months, and there are a host of impressive new user milestones in this quarter’s data too.
However, the most important trends often lie beneath the surface of the headlines, so in this article, we’ll take you beyond the numbers, and explore what people are actually doing online.
Essential takeaways
If you’re short on time, the YouTube video below will guide you through ten of the top stories in this quarter’s report.
However, read on below that for the complete report, and for our comprehensive analysis of this quarter’s key insights and trends.
Top stories in digital in July 2022
In addition to all of our usual data points, essential stories in this quarter’s report include:
The facts about Facebook’s “decline”
The evolution of crypto’s fortunes
Yet another big milestone for TikTok
Digital news behaviours around the world
The rise and rise of mobile
Big gains for Snapchat and Telegram
Impressive growth for Reels
The importance of mobile games
Just before we dive into those stories though, please read the following notes carefully, to ensure you understand how some recent changes in underlying source data and associated research methodologies may impact this quarter’s findings.
Important notes on data changes
Population figures: earlier this month, the United Nations published a comprehensive update to its World Population Prospects data, which included some important revisions to population numbers around the world. In addition to impacting the figures we report for population, these revisions may also affect all data points where we report digital adoption or use as a percentage of total population, or as a percentage of a specific age cohort (e.g. people aged 13 and above). As a consequence, please note that any comparisons to equivalent data points published in previous reports in this series may result in unexpected changes or trends, including potential drops in user figures.
Social media platforms: both YouTube and Instagram also appear to have revised their base data for audience reach since our previous report, which may result in some of the figures for those platforms in the current report appearing lower than the figures we published in previous reports. However, please beware of interpreting any such changes as an actual drop in users or audience reach, as these changes may be the result of changes in methodology or definitions.
To learn more about changes that may impact the comparability of data across reports in the Global Digital Reports series, please refer to our comprehensive notes on data.
Complete Digital 2022 July Global Statshot Report
You’ll find the complete Digital 2022 July Global Statshot Report in the SlideShare embed below (click here if that’s not working for you).
But what does this quarter’s report actually tell us?
Let’s get stuck into all of the numbers to find out…
The global state of digital
To start our tour of this quarter’s data, here are the latest global digital headlines:
Fresh updates to the UN’s population data reveal that there are 7.98 billion people living on Earth in July 2022, with that figure climbing by 66 million (+0.8 percent) over the past year.
Global mobile users grew to 5.34 billion by the start of Q3 2022, with smartphones accounting for almost 4 in 5 of the mobile handsets in use today. The global mobile population has grown by 93 million since this time last year, with almost 67 percent of the world’s total population now using some form of mobile phone.
Internet users have increased by 3.7 percent over the past 12 months, reaching 5.03 billion in July 2022. Year-on-year growth of 178 million new users has pushed global internet penetration up to 63.1 percent.
Social media users grew by 227 million over the past year, reaching 4.70 billion by the start of July 2022. The global social media user base has increased by more than 5 percent over the past 12 months, with the latest global total now equivalent to 59 percent of the world’s total population.
The inflection point of digital growth
These numbers all point to a deceleration in digital growth compared with the impressive increases that we saw during the height of the COVID-19 pandemic.
However, current trends indicate that two-thirds of the world’s total population should be online by this time next year, and social media users should reach the equivalent of 60 percent of the global population not long afterwards.
As a result, it’s safe to assume that we’re now very close to – or perhaps even already at – an inflection point of digital growth, and we should expect to see growth curves continue to flatten out from here on.
But it’s important to stress that this deceleration is inevitable; with the majority of the world’s population now connected, it would be statistically impossible for user numbers to continue growing indefinitely at the rates we saw in 2020 and 2021.
Moreover, the fact that we’ve arrived at this inflection point proves that connected tech is now embedded in the lives of most people around the world.
Consequently, the key question is no longer whether our audiences are actually using these technologies, but what they’re using them for, and how we can take full advantage of the valuable – and constantly evolving – opportunities that these technologies present.
And the good news is that the Global Digital Reports series is packed with all the data and insights you need to answer those very questions.
So, let’s dive into some of this quarter’s richest insights…
Mobile on the move
Mobile has accounted for more than half of the world’s “connected time” since the end of 2018, but its share of connected activity continues to increase.
For example, GWI’s latest data shows that mobile phones now account for 55.5 percent of the time we spend using the internet, up from 52 percent this time last year.
Device preferences vary by age and gender though, with younger women considerably more likely to go online via a mobile phone compared with older men.
Phone-based activities account for more than 60 percent of the time that Gen Z women spend online, but less than 45 percent of the time that male Baby Boomers spend using the internet.
Meanwhile, data from Statcounter indicates that mobile devices account for an increasingly large share of global web traffic.
The company’s latest data shows that nearly 6 in 10 web page requests now come from mobile phones, up from just over 55 percent a year ago.
However, these averages vary wildly by country.
Statcounter reports that mobile phones account for more than 8 in 10 web page requests in Turkey, Egypt, and Nigeria, but they’re only responsible for 27 percent of web traffic in Belgium.
But to put that global mobile figure in perspective, Statcounter now attributes less than 40 percent of global web traffic to laptop and desktop computers, down from 44 percent this time last year.
Computers continue to play an important role in the world’s internet activities though, and Stacounter’s latest data show that laptop and desktop computers still account for more than 7 in 10 web page requests in Equatorial Guinea, Rwanda, Belgium, and the Seychelles.
Computers also remain the most popular means of accessing the web across much of Western and Northern Europe, as well as in Japan.
Returning to the global outlook, rapidly accelerating mobile connection speeds may help to explain the world’s continued shift to mobile.
The latest reports from Ookla reveal that the world’s median mobile internet connection now exceeds 30Mbps, with average download bandwidth increasing by more than 25 percent over the past 12 months.
Admittedly, the average fixed connection is still twice as fast as that – almost 65Mbps – but with most mobile connections now capable of streaming 4K video without delays or buffering, the difference between fixed and mobile connection speeds now has significantly less impact on most day-to-day activities.
Moreover, mobile internet connection speeds are now faster than fixed internet connections in a total of 51 countries around the world.
However, there are still big differences in average mobile connection speeds around the world.
Ookla reports that median mobile connections now exceed 100Mbps in a total of 8 countries, but they remain below 10Mbps in a total of 9 countries.
For context, the median mobile connection in top-ranked Norway is 26 times faster than the current median mobile connection in bottom-ranked Venezuela and Turkmenistan.
Beyond geographic differences, another area where users will notice the difference between mobile and fixed connections is gaming, where latency plays an important part in shaping the experience and the quality of gameplay.
Ookla’s Speedtest data shows that the latency of the typical fixed internet connection is still three times lower than that of the typical mobile connection, so there’s still some way to go before mobile gamers are on a level playing field with their fixed-connection counterparts.
Digital news trends
A few days ago, the Reuters Institute for the Study of Journalism (RISJ) published the 2022 edition of its excellent Digital News Report.
You can read the complete report and analysis on their website, but we’ve included a few of the top findings in this quarter’s report, and summarised our analysis of those stories below.
Just before we dig into the data though, please note that some of the findings in this “Digital News Trends” section may differ from similar data points included elsewhere in this quarter’s report, due to differences in data sources, as well as the timing of respective data collection.
Sources of news
One of the most interesting findings in this year’s Digital News Report is that more than 4 in 5 adults now get their news via digital channels, compared with just 3 in 5 who watch news on television.
However, the more striking finding when it comes to news channels is that people are now 2½ times as likely to turn to social media for news as they are to turn to physical newspapers and magazines.
Women are especially likely to turn to social platforms for news, with almost 6 in 10 female respondents saying that they use social networks and messengers to access and consume news content.
Conversely, women are increasingly unlikely to consume news via print media, with barely 1 in 5 female respondents saying that they read physical newspapers and magazines.
At a country level, people in developing economies tend to be the most likely to turn to online channels for news, with survey respondents in African nations appearing particularly high up in this year’s rankings.
Overall, 95 percent of Nigerian adults and 92 percent of Kenyan adults say that they turn to digital channels for news content, compared with a global average of 82 percent.
Respondents in Japan were the least likely to say they use digital channels for news (65 percent), but adults in the United States came a close second, with just two-thirds of respondents saying that they consume news online.
Devices used for digital news
When it comes to the devices that people use to access digital news, mobile phones are clearly the top choice, with more than 7 in 10 respondents saying that they use smartphones to consume news content.
Men are considerably more likely than women to use a computer for accessing news, with nearly half of the men surveyed saying that they use a laptop or desktop to consume news content.
However, the popularity of using computers to access news varies meaningfully by country.
Just 17 percent of respondents in Mexico said that they use computers for news, compared with 66 percent in Czechia.
Social media as a source of news
Similarly, the use of social media channels to access news content varies meaningfully by geography.
At a global level, the RISJ reports that 57 percent of global adults use social media to discover and consume news content.
However, this rises to 82 percent of respondents in Kenya, and drops as low as 28 percent in Japan.
At first glance, these findings appear to be quite different to the latest wave of research from GWI.
Just 34.8 percent of working-age internet users surveyed by GWI in Q1 2022 said that reading news stories is one of the “main reasons” why they use social media.
However, it’s important to stress that GWI’s survey asks respondents whether reading news stories is one of the main reasons why they use social media, whereas the RISJ survey question is much broader, and simply asks respondents whether they have used social media as a source of news in the past week.
This somewhat nuanced difference adds valuable context to both sets of numbers though, because it may help to identify the difference between what may be more casual or incidental consumption of news content via social media (the RISJ’s research), and more deliberate engagement with news content in social channels (GWI’s research).
The impact of age on use of social media for news
As might be expected, the 2022 Digital News Report reveals that younger adults are more likely to turn to social media for news when compared with their parents’ generation.
Almost two-thirds of respondents aged 18 to 24 said that they use social media as a source of news, compared with less than half of respondents aged 55 and above.
Once again though, these figures tell quite a different story to the findings of GWI’s survey.
GWI’s data shows that 31.2 percent of respondents aged 16 to 24 say that reading news stories is one of the main reasons why they use social media, compared with 35.8 percent of respondents aged 55 to 64.
These differences may allude to the varying importance of news in people’s lives, especially as it compares to other kinds of content and activity.
For example, while the RISJ reports that younger people are more likely to consume news content via social media than older age groups, GWI’s data suggests that younger people’s social news consumption may be more incidental.
In other words, reading the news isn’t a primary reason why younger people open their social media apps, but they still see and engage with news content in their social media feeds.
Conversely, while the RISJ’s data indicates that older age groups are less likely to use social media for news than younger people, news is actually a bigger driver of social media activity amongst these older people.
Social platforms used for news
When it comes to the social media channels that people use for news, the RISJ reports that Facebook still dominates, with nearly half of all survey respondents citing Meta’s largest platform as a source of news.
YouTube comes in second in this year’s ranking, with 3 in 10 respondents saying that they consume news content on Alphabet’s primary video platform.
However, it’s worth highlighting that men are more likely to use YouTube for news than women are.
WhatsApp ranks third in this year’s report, with 22 percent of respondents saying that they use Meta’s most popular messaging platform as a source of news content.
Meanwhile, the number of respondents who say that they use TikTok for news has almost doubled since last year, from 4 percent in the 2021 Digital News Report, to 7 percent in this year’s study.
Trust in news
Trust in news has slipped again over the past year though, with barely 4 in 10 people now saying that they feel they can trust most news, most of the time.
Respondents in Finland have the most positive outlook, with more than two-thirds of respondents in the country expressing faith in the news.
However, Americans are becoming increasingly sceptical.
Barely a quarter (26 percent) of US respondents in this year’s survey said that they feel they can trust the news, down from 29 percent in last year’s study.
News brands on social media
In order to add some additional context to the findings of this year’s Digital News Report, we’ve taken a look at some of the most popular news brands on Facebook and Twitter.
Due to the considerable linguistic challenges associated with identifying all of the top news brands around the world, there’s a very real possibility that the selection of pages and accounts that we’ve identified in this study misses some important news brands that should have made these lists.
However, the brands that we have identified still tell a fascinating story about where the world’s social media users go to get their news.
News brands on Facebook
Perhaps the most startling finding is that – despite the Chinese government still blocking Facebook in Mainland China – the top 5 news brands on Facebook are all Chinese state-controlled media outlets.
CGTN (China Global Television Network) tops the list of news brands on Facebook, with a whopping 118 million followers in July 2022 – a figure that has increased by 1 million since the start of this year.
Meanwhile, China Daily’s Facebook page has also attracted more than 100 million followers, with the current 105 million figure roughly half a million higher than the figure that we reported at the beginning of 2022.
Xinhua News Agency (93.4 million followers), People’s Daily, China (85 million followers), and the Global Times (69 million followers) account for the remaining three places in the top 5 news brands on Facebook.
What’s more, the first four of these pages also make the worldwide top 30 Facebook pages in any category – not just news.
CGTN currently ranks sixth amongst all the pages on Facebook in terms of follower numbers, while China Daily comes in at number 15.
Xinhua News Agency is in 19th position, while People’s Daily ranks 23rd.
For reference, these four pages are the only news brands that make the top 30 pages on Facebook (regardless of category) in July 2022, and no Western news organisation makes that top list.
The Global Times fails to make that top 30 list too, but – at 69 million followers – it’s not too far behind Jason Statham’s page, whose 75 million followers currently place his page in 30th spot.
There may be a meaningful overlap in the audiences of these Chinese media pages, but the key takeaway from their dominance of news brands on Facebook is that China now has a significant “share of influence” when it comes to delivering news and perspectives around the world.
The BBC News page has attracted the largest following of any Western news brand on Facebook, with 58 million followers at the time of writing.
That’s less than half the number of users following CGTN’s Facebook page, but it’s worth highlighting that the BBC also publishes news content across a variety of separate, local-language Facebook pages, many of which have large followings of their own:
BBC Burmese has 23.3 million followers
BBC News عربي [BBC News Arabic] has 15.3 million followers
BBC News বাংলা [BBC News Bengali] has 14 million followers
BBC News Swahili has 3.5 million followers
บีบีซีไทย - BBC Thai has 3.3 million followers
This multi-page, multi-language approach is particularly interesting given the balance of language content across the broader web, which shows that many languages are significantly under-represented.
Aaj Tak appears to have the largest Facebook following of any news-oriented page publishing content in languages other than English, and the Hindi news channel’s page claims close to 33 million followers in July 2022.
For context, across the 30 large news pages that we identified in this analysis, fewer than half (14 pages) post content primarily in the English language, while a further three pages post content in a mix of English and another language.
Languages used on the other pages in this list were as follows (note that some of these pages also post content in English):
Arabic: 4 pages
Hindi: 3 pages
Burmese: 3 pages
Urdu: 2 pages
Filipino: 2 pages
Vietnamese: 1 page
Looking beyond language, it’s also interesting to note that UNILAD and LADBible – both “social-first” news pages – have attracted a greater number of Facebook followers than more traditional news outlets like CNN and Al Jazeera.
For context, BuzzFeed – which some people may consider to be the original “social-first” news page – now has 13.8 million Facebook followers.
News brands on Twitter
Interestingly, the ranking of top news brands on Twitter looks quite different to the Facebook ranking we explored above.
The most obvious difference is that just one of the Chinese state-owned media outlets that dominate the Facebook rankings makes it into our list of top news brands on Twitter.
What’s more, that account – @CGTNOfficial – sits towards the bottom of this list, with 13.3 million followers at the time of writing.
@CNNBRK (CNN Breaking) has the largest audience of any news brand on Twitter in July 2022, with more than 63 million followers.
Meanwhile, another CNN-operated account – @CNN – claims second spot in the rankings, with 58.9 million followers.
In total, CNN operates 5 of the 30 top news accounts on Twitter that we identified during this study:
@CNN (CNN’s ‘primary’ account): 63.3 million followers
@CNNBRK (CNN Breaking): 58.9 million followers
@CNNEE (CNN en Español): 21.9 million followers
@CNNI (CNN International): 13.9 million followers
@CNNArabic (CNN Arabic): 13.2 million followers
Returning to the top spots, the New York Times ranks third for news brands on Twitter with 53.5 million followers, while two BBC accounts – @BBCBreaking (50.3 million followers) and @BBCWorld (37.3 million followers) – round out the top 5.
Amongst the 30 largest news accounts on Twitter that we identified, 11 post content that is predominantly in languages other than English.
Notably, 7 of these accounts publish news in Arabic, highlighting Twitter’s popularity across the Middle East.
However, despite Twitter’s popularity across Latin America, we only identified one Spanish-language account – @CNNEE (CNN en Español) – that had a sufficient number of followers to qualify for this ranking.
It’s also interesting to note that – despite Twitter positioning itself as a source of news – just two news accounts appear in our latest ranking of the top 20 Twitter accounts across all categories.
Indeed, 15 of those top 20 accounts represent individual people, with Barack Obama’s account (132.3 million followers) still topping the global ranking.
On a side note, a timely bit of trivia that stood out for me in this top 20 ranking is that Elon Musk currently has significantly more Twitter followers (101.3 million) than Twitter itself (62.1 million).
Crypto’s fluctuating fortunes
Despite the recent collapse in the valuations of Bitcoin and Ethereum, data from GWI shows that ownership of blockchain-based currencies continues to grow.
Nearly 1 in 8 working-age internet users say that they now own some form of cryptocurrency, with that figure rising to almost a quarter of internet users in Turkey.
To put these figures in perspective, across the 48 countries that GWI’s research covers, survey responses indicate that more than 330 million people may now own some form of cryptocurrency.
This is broadly in line with research from Crypto.com, which found that 295 million people owned some form of cryptocurrency by the end of 2021.
Ownership is still skewed by gender though, and GWI reports that men are currently 60 percent more likely to own cryptocurrency than women are.
But perhaps the biggest story in the latest data is the overall growth in crypto adoption.
Indeed, the number of people around the world telling GWI that they own some kind of crypto has jumped by more than 50 percent over the past year alone.
The timing of this growth may point to problems, however.
For context, research from Crypto.com suggests that roughly two-thirds of all crypto owners held at least some Bitcoin or Ethereum (or both) at the end of last year.
But the value of Bitcoin has fallen by more than 70 percent since its most recent high in November 2021, and the value of Ether has dropped by an even more precipitous 75 percent during the same period.
As a result, many of those crypto owners who entered the market over recent months will likely have seen the value of their initial investment fall by a significant margin since they entered the crypto world.
There’s little data available on the potential average value of individuals’ crypto holdings, but research cited by Fortune indicates that a meagre 0.01 percent of Bitcoin owners hold more than 25 percent of the currency’s total value.
Based on Crypto.com’s report of 176 million Bitcoin owners at the end of 2021, this research suggests that barely 17,600 individuals and organisations hold more than a quarter of Bitcoin’s total value.
Furthermore, despite the steady increase in overall ownership, data.ai reports that there has been a meaningful drop in the use of mobile apps used for purchasing and trading cryptocurrencies, suggesting that “retail” crypto trading has slowed.
Data.ai’s analysis reveals that the total time spent in crypto apps has fallen by 20 percent since this time last year, with the combined time spent using the 10 top crypto apps now down by roughly two-thirds since its peak in March 2021.
However, this precipitous fall doesn’t necessarily indicate that large swathes of crypto owners have sold their holdings.
For example, some owners may simply be “HODLing” – i.e. holding on for dear life – and waiting for the price of Bitcoin and Ethereum to recover before they resume regular trading.
NFT… WTF?
Overall levels of awareness continue to increase, but most people still don’t understand NFTs (non-fungible tokens).
A recent Zeitgeist study by GWI across 9 countries around the world found that more than two-thirds of people have at least now heard of NFTs, but fewer than 3 in 10 people say that they understand what NFTs really are.
More than a quarter of the survey sample said that they thought NFTs were a form of cryptocurrency, indicating that there’s still a long way to go before NFTs become mainstream.
Moreover, 1 in 5 of those who claimed that they “understand” NFTs selected “a type of cryptocurrency” as the best definition of these instruments, suggesting that a meaningful number of those people who think they understand NFTs may actually be less knowledgeable than they’d like to admit.
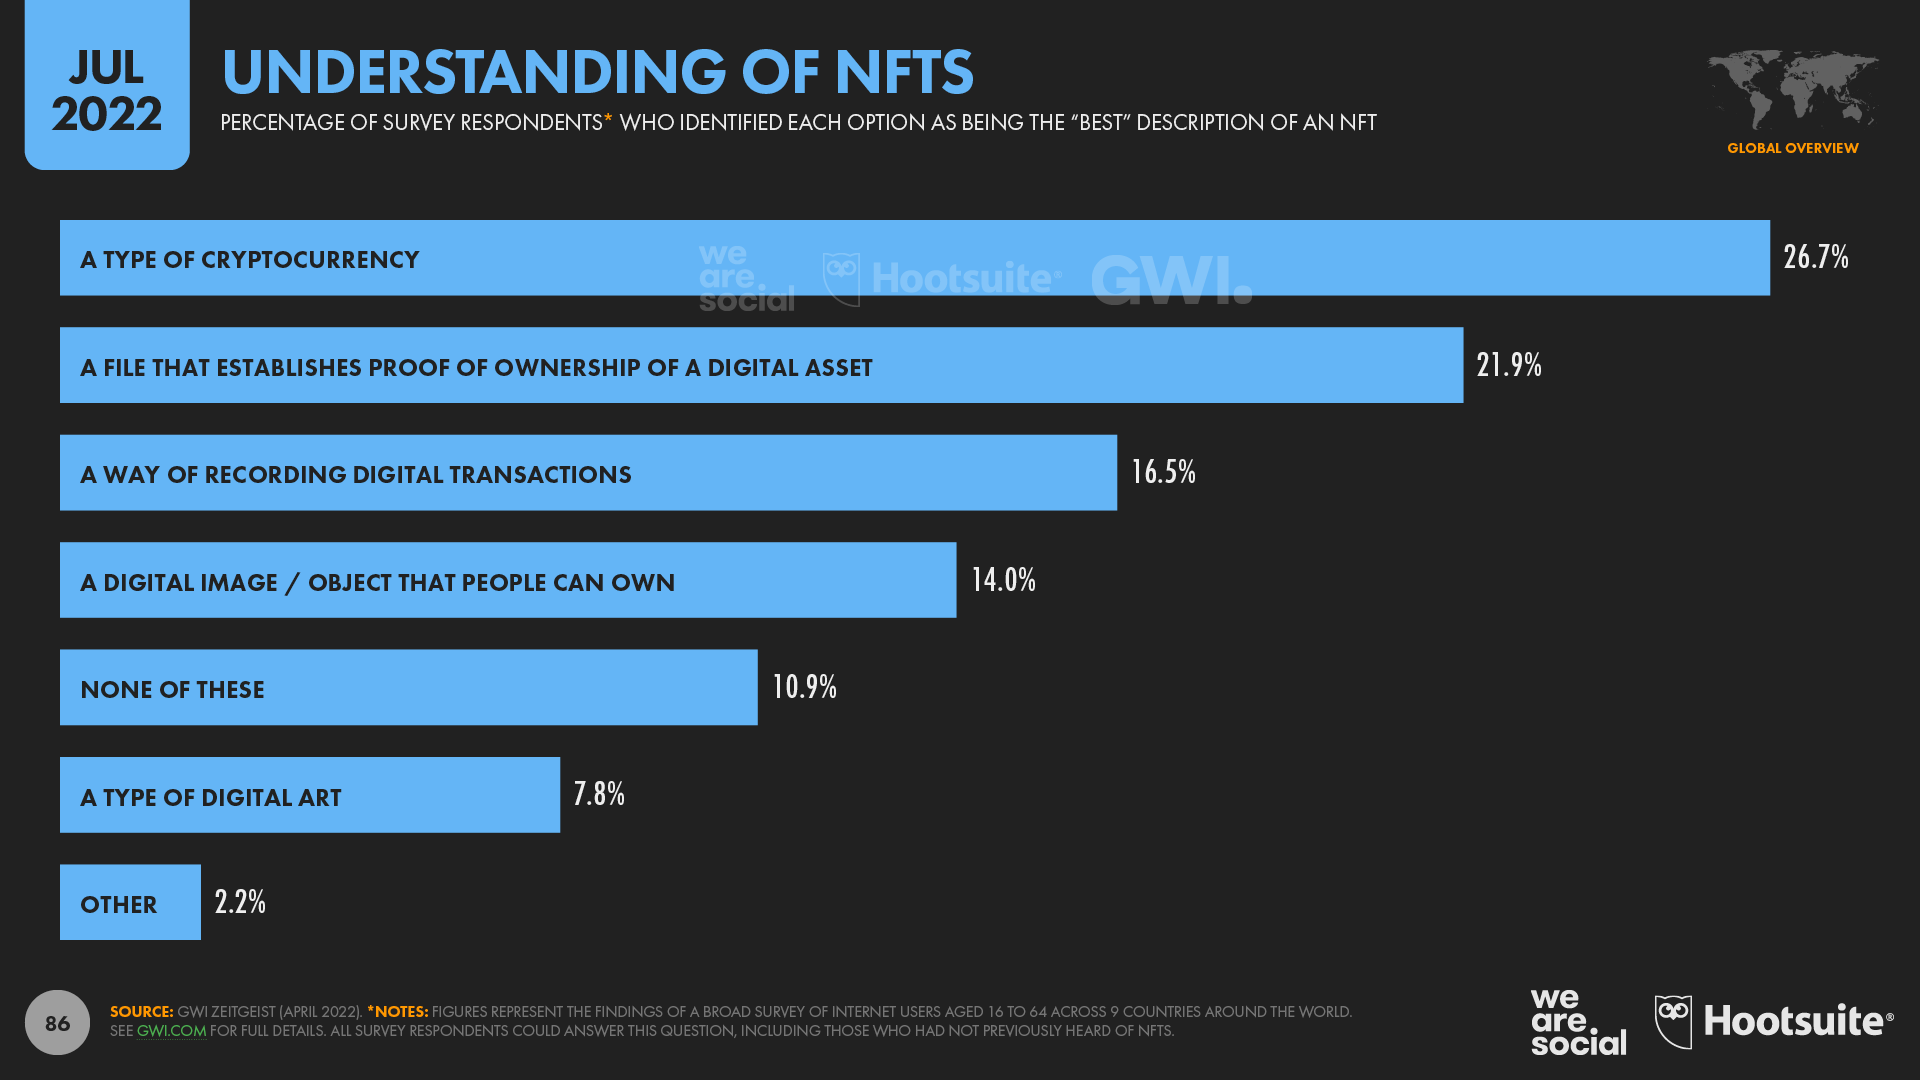
Understanding of NFTs July 2022 DataReportal
There’s little solid data on the number of individuals who actually own an NFT, but one of the more commonly cited figures comes from a report published in the Financial Times, which stated that roughly 360,000 people owned an NFT at the end of 2021.
However, the same study found that barely 9 percent of those owners – some 32,400 individuals – held more than 80 percent of the nominal value of the erstwhile NFT market.
NFT trading slows significantly
Meanwhile, research published by NonFungible.com suggests that the number of blockchain wallets trading NFTs – whether as buyers or as sellers – fell by more than 50 percent during the first quarter of 2022, with fewer than 150,000 wallets trading NFTs in the last week of March.
And figures published on NonFungible.com’s website suggest that NFT trading activity has continued to decline since then too.
According to the site’s “Market Trends” section, there were fewer than 250,000 NFT sales in the 7 days leading up to 15 July 2022, compared with an all-time high of 1.27 million sales in the 7 days leading up to 24 November 2021.
These figures indicate that weekly NFTs sales have dropped by more than 80 percent since November 2021, although activity has recovered since the most recent low of 165,000 sales in the 7 days ending 17 June 2022.
In its Q1 2022 Market Report, NonFungible.com states that “collectibles” currently account for the largest share of the NFT industry, with more than half a million wallets executing a total of 2.7 million trades across the first three months of 2022.
The combined value of these trades equated to USD $6.1 billion, although it’s worth noting that this figure may include multiple trades of the same asset.
However, Reuters reports that the monthly value of NFT trades on the OpenSea marketplace has fallen by a thumping 85 percent since January.
The article states that the value of transactions in June 2022 amounted to USD $700 million, as compared with almost USD $5 billion just six months earlier.
This corresponds with similar trends in the data published on NonFungible.com.
The site’s “Market Trends” section shows that the cumulative value of weekly NFT sales in the 7 days ended 15 July 2022 amounted to USD $224 million, compared with an all-time high of USD $1.92 billion in the 7 days ended 29 August 2021.
This data suggests that the weekly value of NFT transactions has fallen by almost 90 percent since its all-time high.
Investor scepticism grows
Part of this trend may be explained by the fact that the value of Ethereum – one of the core currencies used in the trade of NFTs – has fallen by more than 70 percent since its all-time high in November 2021.
But given the breadth of declines, it’s perhaps not surprising that a survey published by Bloomberg on July 11th found that barely 9% of investors now see NFTs as a promising investment opportunity.
Meanwhile, the growing scepticism of NFTs’ investment value may be further exacerbated by an increase in NFT “washing” – a practice whereby the same individual or organisation trades a single NFT between a number different wallets under their control, in an attempt to artificially inflate the perceived value of that NFT.
In its Q1 2022 Market Report, NonFungible.com stated that wash trading may have accounted for more than half (52.2 percent) of the total value of NFT trades executed during the first three months of 2022, up from 43.2 percent in the last quarter of 2021.
However, it’s critical to remember that NFTs aren’t restricted to speculative investment assets.
NonFungible.com reports that gaming-related assets still account for the largest share of NFT trades, with close to 1 million wallets trading game-related NFTs in the first 90 days of this year.
Somewhat surprisingly though – especially given the recent media furore – metaverse-related NFT sales only account for a tiny fraction of NFT trading.
NonFungible.com reports that just over 53,000 metaverse-related NFTs were traded between January and March 2022, representing just 0.7 percent of the 7.45 million NFT sales that the company tracked in Q1.
In total, metaverse-related assets accounted for just 1.6 percent of the 34.4 million NFTs in circulation at the end of March, compared with 65.4 percent for gaming-related NFTs.
However, despite continued confusion and growing investor scepticism, we have little doubt that NFT technology is here to stay.
In particular, we expect to see a meaningful rise in the use of “digital twins” – NFTs associated with physical-world assets – that build on existing initiatives by organisations like Mattereum.
Time spent on social
There has been a lot of chatter on social media in recent weeks about the amount of time that people spend using social platforms, but – unfortunately – some of the most widely referenced data has been misrepresented.
So, to help make sense of what’s really going on, our Digital 2022 July Global Statshot Report includes two separate charts on the time spent using social media apps: one that uses data from data.ai to show average time per month, and another that uses data from Sensor Tower to show average time per day.
Apart from showing different metrics, note that these two datasets also cover different periods of user activity, so the figures on one chart won’t correlate with those on the other.
Also, for clarity, note that all of the figures in this section – from both data.ai and from Sensor Tower – represent averages for worldwide users outside of Mainland China.
Interestingly, each chart offers a slightly different take on social media behaviours, but both offer hugely valuable perspectives.
Data.ai’s analysis indicates that the average global TikTok user outside of Mainland China now spends almost a full day (23.6 hours) each month using the platform’s Android app, putting it at the top of the latest rankings.
For context, assuming that the typical person sleeps for between 7 and 8 hours per day, these latest numbers suggest that TikTok users now spend close to 5 percent of their waking hours watching TikTok videos.
YouTube isn’t far behind TikTok though, with the platform’s Android users spending an average of 23.2 hours per month using the YouTube app between January and March 2022.
However, it’s worth remembering that a considerably larger share of YouTube viewing will take place on laptop and desktop computers and connected TVs compared with TikTok.
As a result, there’s a good chance that each individual viewer still spends more time watching YouTube videos across all devices than they do watching TikTok videos.
Furthermore, the latest ad reach data shows that YouTube’s adult (18+) audience is roughly 2½ times bigger than TikTok’s adult audience, so YouTube’s total, cumulative time spent is likely still more than double that of TikTok.
Indeed, this hypothesis is backed up by another set of findings from data.ai, which shows that YouTube captures the greatest amount of total, cumulative time spent by all users across all mobile apps.
But this additional context doesn’t detract from the significance of TikTok’s achievement in reaching the top of the rankings for average monthly time spent per user.
It’s also important to highlight that the time users spend in the TikTok app is still growing rapidly, whereas the time users spend in the YouTube app has actually decreased slightly over recent months.
For comparison, in our Digital 2022 Global Overview Report, we saw that users spent an average of 19.6 hours per month using TikTok’s Android app across the whole of 2021, compared with 23.7 hours per month for YouTube’s Android app users.
So, the latest figures show that TikTok’s time per user has increased by more than 20 percent in Q1 compared with full-year 2021, whereas YouTube’s time per user decreased by just over 2 percent.
Moreover, as we’ll see later in this analysis, TikTok’s audience is still growing too, while YouTube has actually revised its audience figures down since our April update (although this revision is most likely due to the effect of ongoing sanctions on Russia).
Looking beyond the top two places, it’s interesting to see that Facebook still claims third spot in the global rankings, at an average of 19.4 hours per month, per user.
But in a finding that’s more likely to worry Zuck and team, data.ai’s data shows that the average Instagram user spends exactly half the amount of time using Instagram as the average TikTok user spends using TikTok.
Instagram users still spend almost half a day per month using the platform’s Android app though, which equates to almost 2½ percent of their waking hours.
Furthermore, while differences in total user numbers mean we can’t simply add up the values for each platform, these latest figures suggest that people still spend more than 2 full days per month using Meta’s various platforms.
For broader context, GWI reports that the typical social media user now spends 2 hours and 29 minutes per day across all social platforms, which adds up to roughly 75½ hours per month.
That means we now spend more than 3 full days using social media each month, equating to roughly 15 percent of our waking lives.
Meanwhile, Sensor Tower’s data for time spent by platform offers equally fascinating insights.
The company reports that users who have the TikTok app installed on an Android phone spent an average of more than 1½ hours per day using that app between April and June 2022 – significantly more than the time spent with any other social media platform’s Android app.
This figure suggests that TikTok users now spend more than 2 days – 48 hours – per month using TikTok, which is even higher than the figure identified in data.ai’s Q1 analysis above.
For additional comparison, Sensor Tower reports that YouTube’s Android app users spent 74 minutes per day using the app during in Q2, which equates to 22 percent less time than TikTok’s Android app users spent using the TikTok app during the same period.
Instagram ranks third in Sensor Tower’s latest analysis of daily time spent, with the platform’s Android app users spending an average of 51 minutes per day using the app in Q2 2022.
But the stat in Sensor Tower’s data that’s most likely to grab headlines is that the typical Facebook user now spends roughly half the amount of time using Facebook’s Android app as the typical TikTok user spends using TikTok’s Android app.
As we’ll explore in more detail in the next section, the frequency with which people use each app may help to explain the big differences between the Facebook and Instagram findings in data.ai’s data versus Sensor Tower’s data.
On average though, Sensor Tower reports that global Facebook users now spend 49 minutes per day using Facebook’s Android app, compared with the 95 minutes that global TikTok users spend using the TikTok Android app.
However, it’s worth remembering that Facebook still has significantly more monthly active users than TikTok, so Facebook may still garner more total, cumulative time than TikTok.
Other data suggests that it may only be a matter of time before these two apps reach parity though, as we’ll explore in more detail in the next section.
TikTok ads now reach 1 billion adults each month
The latest numbers published in Bytedance’s advertising resources reveal that TikTok ads now reach more than 1 billion people aged 18 and above.
For context, that means that TikTok ads now reach 22.9 percent of all adults outside of China each month.
TikTok continues to add new users at an impressive rate too, with its global ad reach increasing by 52 million (+5.4 percent) over the past three months alone.
That’s slightly lower than the rate we saw in last quarter’s report, but still means that TikTok is adding more than half a million new users every day.
However, it is worth noting that TikTok has slipped down to third place in data.ai’s latest ranking of apps by new downloads, behind both Instagram and Facebook.
Empowering creators
But the ninth position in data.ai’s active user ranking tells what might be an even more interesting story about TikTok’s evolution.
For context, CapCut is Byetdance’s free video editing software, and the mobile app appears to have been designed specifically to enable TikTok users to create even more compelling videos.
So, the fact that so many people appear to be using this app each month suggests that significant numbers of people are creating – or at least attempting to create – their own videos for TikTok.
And this has particular relevance when we consider TikTok’s role in people’s lives.
Critically, the more content that a user publishes to a platform, the more ‘vested’ in that platform the user is likely to become.
Moreover, when users upload more content, the platform has more content to add to its feed, giving it more opportunities to engage users – and to show advertising.
But beyond its impact on TikTok, CapCut’s growing popularity may also point to a change in people’s broader attitudes towards creativity.
As data.ai’s analysts note in their commentary on CapCut’s rise,
“Its presence in the top 10 is a reflection of the democratisation of video production software. What used to be a professional skill is now a hobby and a powerful engine of the new creator economy.”
Create or consume?
But in apparent contrast to these findings, GWI’s data reveals that consuming funny and entertaining content remains the top activity on TikTok, and just 35.4 percent of working-age adults outside of China say that they post or share their own content on the platform.
That compares with 42.7 percent of Snapchat users, 64.5 percent of Facebook users, and an impressive 70.2 percent of Instagram users.
For now though, this lower publishing ratio doesn’t appear to be much of a problem for Bytedance.
New research from Sensor Tower reveals that TikTok ranks second for frequency of use amongst social media apps, with only Instagram seeing a higher frequency of app use.
Sensor Tower’s analysis indicates that roughly 3 in 10 TikTok users who use the platform’s Android app opened the app every single day between April and June 2022.
This compares with roughly 4 in 10 Instagram users who open Instagram each day, while the figure for Facebook was 27 percent.
Meanwhile, given TikTok’s focus on entertaining videos, it’s particularly interesting to note that just 1 in 5 YouTube users open the app every day.
However, it’s worth remembering that many people will consume YouTube videos via computers and connected TVs as well as via the platform’s mobile apps, whereas TikTok use is more likely to occur within the platform’s mobile apps.
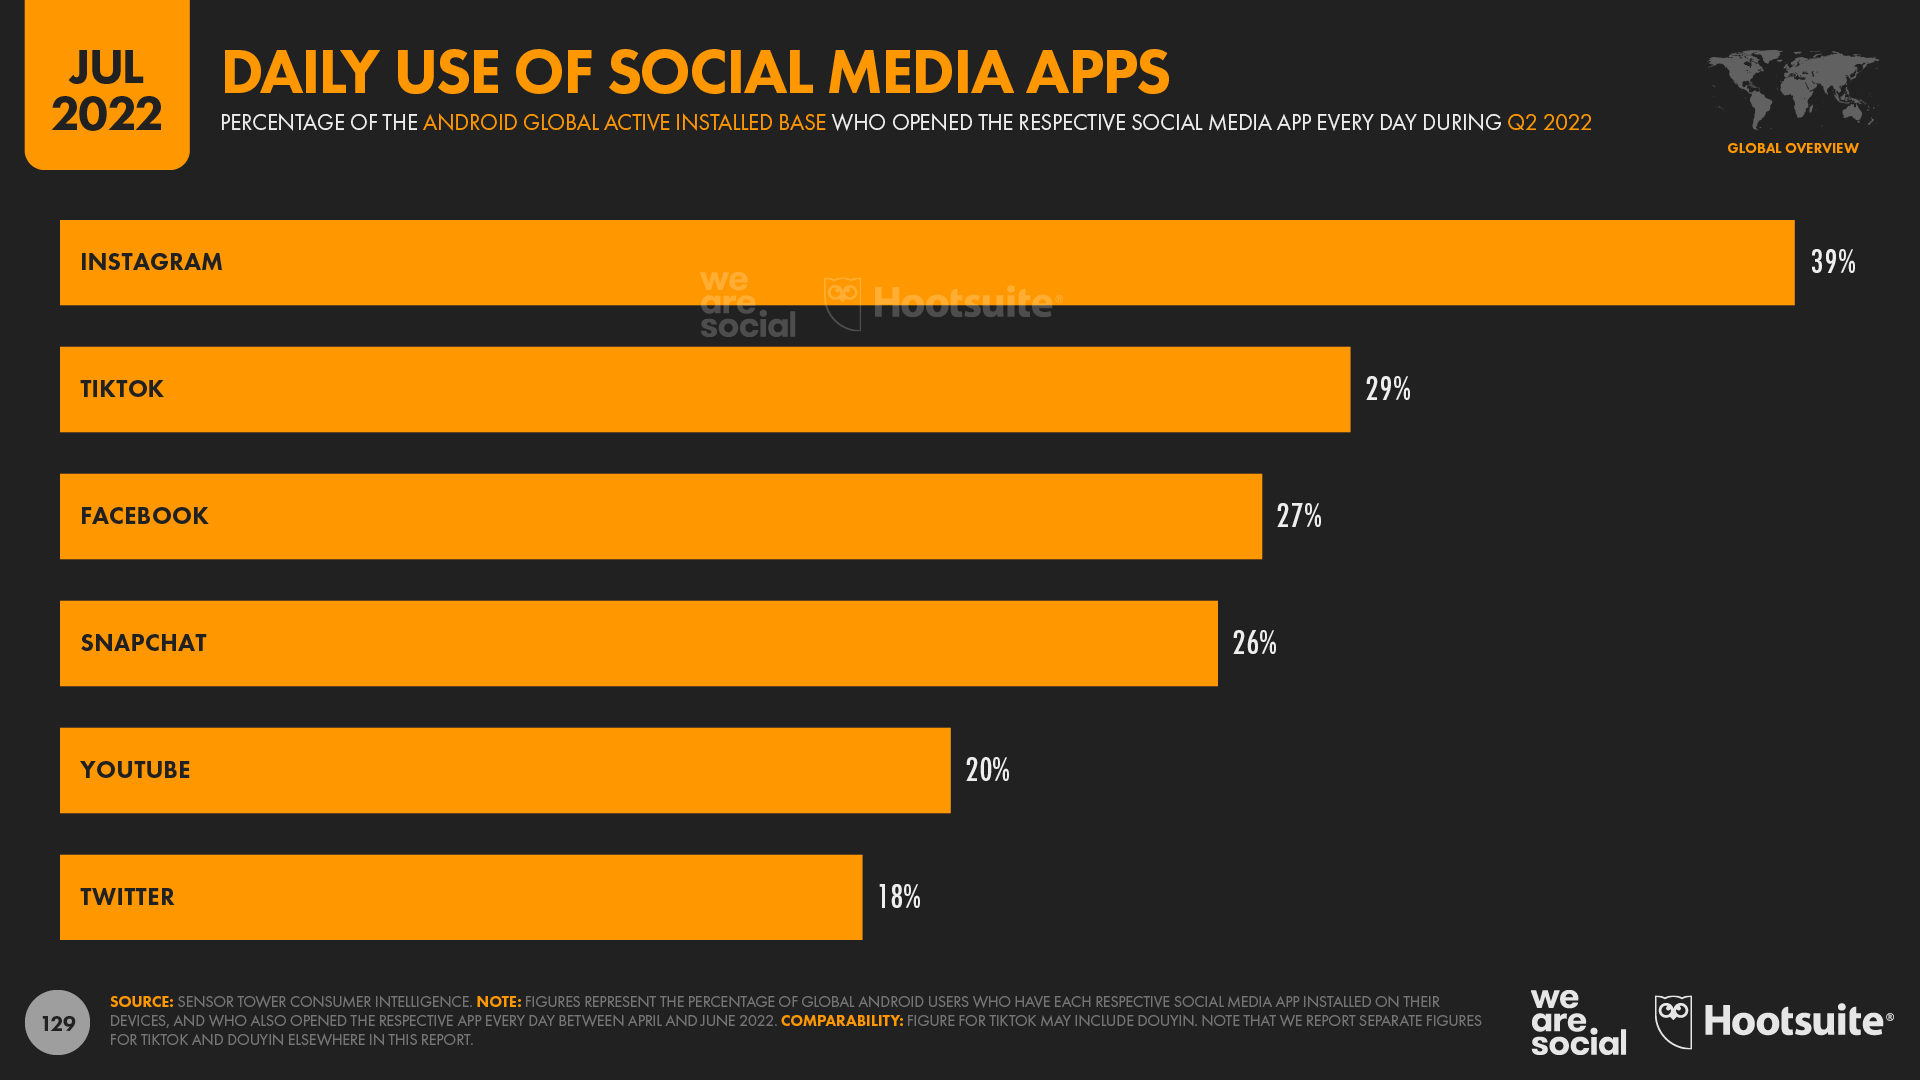
Daily Use of Social Media Apps July 2022 DataReportal
No, Facebook isn’t dead
Despite perennial media headlines foretelling the demise of Facebook, Meta’s latest ad-reach data show that tales of Facebook’s death continue to be very much exaggerated.
The company’s own resources reveal that global Facebook ad reach actually increased by 1.2 percent between April and June, taking the platform’s total global advertising audience to 2.17 billion.
The platform’s total user base continues to grow too, with the company’s Q1 2022 investor earnings update reporting quarter-on-quarter growth in monthly active users (MAUs) of 0.8 percent [click here to learn why we report different numbers for Facebook’s ad reach and MAUs].
Furthermore, once we factor Facebook’s age limitations and the fact that the platform remains ostensibly ‘blocked’ in Mainland China, Facebook’s latest MAU figures indicate that almost 6 in 10 people (58.6 percent) on Earth who can use Facebook already do.
A mysterious myth
Given these impressive figures, it’s unclear why some media outlets continue to misrepresent the state of Facebook’s health.
Such misrepresentation isn’t a new phenomenon, either; news headlines have been telling us that “Facebook is dying” for well over a decade.
Indeed, a New York Times headline proclaimed a “Facebook Exodus” as early as August 2009, when the platform had fewer than 350 million users.
Facebook’s user base has grown eightfold since then, equating to almost 2.6 billion additional users.
So, my tip would be to wait until Zuck himself says it’s over before you pay too much heed to click-bait.
Compare and contrast
However, there is more to this story than these headline figures suggest.
For starters, Facebook’s recent growth rates are nowhere near as impressive as those of TikTok, whose ad audience has grown over four times faster than Facebook’s audience over the past three months.
But while there’s no denying TikTok’s rapid ascent, it’s also important to put the platform’s growth figures in context.
Just before we do that, it’s worth noting that Bytedance’s advertising tools only report ad reach data for audiences aged 18 and above, so – in order to provide a balanced comparison – we’ll focus on the same cohort for Facebook.
Bytedance also operates a separate platform for Mainland China (Douyin), and while Facebook is technically still blocked in the country, it still reports some nominal ad reach in China, so we’ve removed Facebook’s Mainland Chinese users from the following analysis.
With those caveats in mind, data published in each respective platform’s tools show that:
Facebook ads reach 2.04 billion users aged 18 and above outside of Mainland China in July 2022
TikTok ads reach 1.02 billion users aged 18 and above outside of Mainland China in July 2022
It’s worth acknowledging that TikTok may well have more users below the age of 18 than Facebook does, but because Bytedance’s tools don’t publish audience reach data for users below the age of 18, it’s difficult to know for sure.
Either way though, the big takeaway for marketers here is that Facebook ads still reach twice as many adults as TikTok ads do.
Moreover, if both platforms were to sustain their current growth rates – which is unrealistic for both platforms, but especially so for TikTok given the speed of its current ascent – the data suggest that TikTok’s ad reach wouldn’t catch up with Facebook’s reach for at least another 4 years.
The measures that matter
But perhaps the most important finding when comparing these two platforms is that most social media users outside of Mainland China now use both Facebook and TikTok – and many other platforms as well.
Indeed, the “typical” global social media user now makes active use of almost 7½ social media platforms every month.
Moreover, GWI’s data shows that a hefty 84 percent of TikTok users still use Facebook, while less than 0.05 percent of TikTok users – i.e. fewer than 5 in every 10,000 – surveyed by GWI said that they don’t use any other social platform.
Meanwhile, just over half of all working-age Facebook users also use TikTok – a finding that aligns closely with the various figures that we explored above.
So, perhaps it’s time for marketers to stop pitting these platforms against each other.
Yes, there is still competition for people’s time and attention, and the more of these valuable resources that a platform can attract, the greater that platform’s potential for generating revenue.
However, that consideration likely has more bearing for investors than it does for marketers, especially because marketers should only pay for advertising when their content is actually shown to their chosen audiences.
Sure, marketers still need to decide how to allocate their budgets between different social platforms, but all of the figures above indicate that user numbers alone are a poor basis for that allocation.
So, if you’re looking for some more representative metrics on which to base those allocation decisions, I’d recommend:
Cost per outcome: how much money would you have to spend on each platform to reach your audience and – critically – to achieve your desired objectives? Given that we can now reach almost all of the users of any given social media platform on at least one other social platform, it’s well worth exploring which platforms offer the most cost-efficient opportunities to reach your target audience and deliver your desired outcomes.
Creative opportunities: different platforms offer different media formats, each with their own advantages and limitations. Because of this, it’s well worth exploring which creative formats might offer the most effective and engaging ways of delivering your brand’s message, well before you start thinking about which platform(s) you’ll use to deliver that content.
Usage context and motivations: our audiences use different platforms for different reasons, and they’re likely to be in different settings, mindsets, and emotional states when they use each platform too. Where and when will your brand’s message have the greatest resonance in your audience’s life, and which platforms are most likely to align with those contexts?
And no, the kids aren’t all leaving Facebook either
Continuing a story I touched on in last quarter’s analysis, our July 2022 data may help to dispel another common misconception about Facebook’s current momentum.
Contrary to yet more click-bait mischief, audience reach data do not support the claim that “the kids are leaving Facebook”.
In fact, Facebook’s latest global ad-reach numbers show that teenage audiences are still growing, with the platform adding 1.35 million users between the ages of 13 and 19 between April and June 2022.
For reference, that equates to quarter-on-quarter growth of 0.6 percent.
Sure, that’s nothing like as impressive as the growth we’d expect to see amongst this demographic on a platform like TikTok, but it’s still growth.
In other words, on a net-change basis, the kids are still joining Facebook – not leaving it.
It is worth acknowledging that teens now represent a smaller percentage share of Facebook’s total audience, but that’s largely because the number of users in older age groups – especially the over-50s – has increased more quickly in recent months than teenage users have.
For context, in July 2019, Facebook ads reached roughly 115 million Facebook users between the ages of 13 to 17, accounting for 5.9 percent of Facebook’s total ad audience.
At that time, Facebook reported ad reach of 194 million users aged 55 and above, who accounted for 10 percent of the platform’s total audience.
Three years later – in July 2022 – Facebook ad reach amongst 13 to 17s has grown to almost 121 million, but this demographic’s share of Facebook’s total ad reach has slipped to 5.6 percent.
This is partly because Facebook ads now reach 262 million users aged 55 and above, with this demographic now accounting for 12.1 percent of the platform’s total ad reach.
Figures vs. feelings
But looking beyond absolute user numbers, there’s little denying that Facebook’s role in teens’ lives has declined considerably since the heady days of the early 2010s.
For example, GWI reports that Facebook now ranks just fifth amongst the “favourite” social media platforms of women aged 16 to 24, although Zuck and team will be relieved to hear that Instagram is still well out in front for this particular demographic.
Interestingly, Facebook fares better amongst Gen Z males, although the platform still ranks below Instagram and WhatsApp.
However, Facebook is still the “favourite” choice for Millennial males, just ahead of WhatsApp.
Another salient finding in this data is that 48.6 percent of all global social media users – including those in China – still choose one of Meta’s platforms as their “favourite”.
What’s more, if we remove those users in Mainland China – where all of Meta’s platforms remain blocked – roughly two-thirds of social media users identify either WhatsApp, Facebook, Instagram, or Messenger as their favourite platform.
And critically, Meta’s platforms still dominate amongst younger users too.
At a global level (including China), 45.9 percent of female social media users aged 16 to 24 identify one of the company’s four platforms as their favourite, while more than half (51.3 percent) of their male peers do the same.
And if we remove users in Mainland China, those figures rise to 60.6 percent for female social media users aged 16 to 24, and 65.7 percent for male users in the same age group.
Telegram soars
A recent company blog post reveals that Telegram now has more than 700 million monthly active users, suggesting that that platform has added roughly 200 million active users in just the past 18 months.
The exact dates of the platform’s user milestones remain unclear, but this latest figure suggests that Telegram’s active user base is currently growing at an annualised rate of roughly 25 percent, or close to 6 percent per quarter.
That means Telegram may be growing even faster than TikTok, whose adult ad audience increased by 5.4 percent over the past 90 days.
Telegram’s impressive trajectory isn’t just evident in its own data, either.
Data.ai’s latest ranking of mobile apps by monthly active users puts Telegram in sixth place – behind TikTok, but ahead of Amazon and Twitter.
Meanwhile, data.ai’s latest ranking of “breakout” apps shows that Telegram ranks second in terms of quarter-on-quarter growth in monthly active users – ahead of all other social media platforms, including TikTok.
Telegram’s app continues to attract new users too, with Sensor Tower reporting 28 million combined worldwide downloads across the Google Play Store and iOS App Store in June 2022 alone.
That’s not quite as high as some of its peers, although download numbers can be misleading.
For context, Sensor Tower’s data suggests that TikTok saw 52 million new downloads across its TikTok, TikTok Lite, and Douyin apps in June 2022, while Instagram attracted 58 million new downloads across Instagram and Instagram Lite during the same period.
However, it’s unclear how many of these new downloads represent actual ‘new’ users, as opposed to existing users simply downloading the app onto a new device.
Moreover, it’s difficult to predict how many of the truly ‘new’ downloads will convert into regular, active users of each platform, so I’d advise caution when interpreting app download figures.
Snapchat jumps too
Meanwhile, Snapchat’s latest numbers are almost as impressive as Telegram’s.
According to data published in the company’s own tools, Snapchat’s ad audience has grown by more than 100 million users since this time last year, equating to annual growth of 20 percent.
Snapchat ads now reach almost 617 million users around the world each month, which equates to roughly 10 percent of the ‘eligible’ global audience aged 13 and above.
Snapchat is particularly popular across the Middle East, as well as in countries across Northern and Western Europe.
The rise of Reels
Data published in Meta’s advertising resources indicate that Reels ads have reached a significantly greater number of users over the past 30 days than they did just three months ago.
For reference, in April 2022, Meta reported that ads in Facebook Reels reached 125.0 million users around the world, while ads in Instagram Reels reached 686.9 million users.
Just 90 days later, however, those figures look quite different.
Meta’s tools show that ads in Facebook Reels can now reach 473.5 million users, while ads in Instagram Reels can reach 754.8 million users.
For comparison, that means the Facebook Reels ad audience has grown by almost 350 million users over the past 3 months – a hefty 279 percent increase.
The growth figures for Instagram Reels are somewhat less dramatic, but the format’s audience has still grown by 68 million users (+9.9 percent) since April 2022.
A risk of cannibalisation?
However, the growth of Facebook Reels may have come at the expense of some of the platform’s other ad placements.
For example, Meta’s own data suggests that the number of users seeing ads in Facebook Instant Articles has dropped by 8.4 percent over the past quarter, while the number of users who have been shown ads in Marketplace has fallen by almost 5 percent since April.
But this shift may actually be part of Meta’s plan.
For context, in a recent investor earnings call, Mark Zuckerberg clearly stated that Meta intends to prioritise activities that keep people within Meta’s platform environments:
“We started by building world class ads tools to help businesses reach potential customers and help people discover new products and services that they might like. But what we’ve found is that when [Shops and Marketplace] ads link offsite, you often land on a webpage that’s not personalised or not optimised, or where you have to re-enter your payment information. That’s not a good experience for people, and it doesn’t lead to the best results for businesses either. So our next phase is focused on building out Shops, Marketplace, and business messaging in WhatsApp and Messenger to create more native commerce experiences across our apps.”
This may mean that Meta will start to place less emphasis on ads in Facebook Marketplace and Instagram Shop that direct users to third-party sites, in favour of creating more “on-platform” social commerce offerings.
Despite this potential shift in focus, however, the ad reach of Instagram’s Shop tab still jumped over the past 90 days.
276 million Instagram users were served ads in Shop during June 2022, compared with 197.4 million in March 2022, equating to an impressive quarter-on-quarter growth rate of almost 40 percent.
The demographics of Reels
Returning to Reels, it’s interesting to note that male users tend to over-index in the ad audiences of these formats.
Overall, 47.2 percent of Instagram’s ad audience is female, while 52.8 percent is male.
However, if we focus on the ad audience of Instagram Reels, the imbalance becomes more apparent: 44.3 percent female vs. 55.7 male.
Similarly, while Facebook’s overall ad audience is currently 43.3 percent female and 56.8 percent male, the Facebook Reels audience tilts to 37.8 percent female vs. 62.2 percent male.
Our analysis suggests that this may be because Indian users significantly over-index in the audiences of both formats.
For context, India has one of the most significant gender imbalances in the world when it comes to social media use, and men account for a whopping three-quarters of the country’s ad audience across Facebook and Instagram.
Meanwhile, Indian users account for roughly a quarter of the worldwide ad audience for both Facebook Reels and Instagram Reels in July 2022, so the country’s local gender skew will likely play a disproportionate role in shaping the worldwide gender profile of Reels audiences too.
Messengers are the medium
In addition to the impressive growth in Telegram users that we explored earlier in this article, there’s more good news for messaging platforms in this quarter’s data too.
The latest insights from data.ai show that WhatsApp Business was one of the 10 most-downloaded mobile apps between April and June 2022, moving up three places versus its ranking in Q1.
This impressive result demonstrates that Meta’s efforts to earn revenue from WhatsApp may be starting to pay off – eight years after the company paid USD $21.8 billion to acquire it.
Furthermore, evidence of this trend isn’t restricted to data.ai’s research.
At its inaugural “Conversations” messaging conference in May, Meta reported that:
“One billion people message with a business each week on WhatsApp, Messenger and Instagram Direct – whether it’s DMing brands, browsing product catalogues, asking for support, or interacting with stories.”
These figures indicate that messaging apps represent a growing opportunity for social media companies and for brands, and we expect to see an increase in messenger-related marketing activities around the world over the coming months.
Mobile gaming levels up
Research from data.ai shows that mobile titles are now responsible for 60 percent of worldwide consumer spend on video games.
The company forecasts that mobile games will generate a total of USD $136 billion in revenue in full-year 2022, compared with USD $42 billion for console games, and $40 billion for PC and Mac titles.
Games also account for the lion’s share of consumer spend across the iOS App Store and Google Play Store:
“Games are set to account for 65 cents of every $1 spent in the two stores in Q2 2022, [contributing] 72 percent of consumer spend on Google Play, and 62 percent on the iOS store.”
In total, gamers spent USD $21.5 billion on mobile games and in-app game purchases in these two stores between April and June 2022, which is 30 percent more than the amount they spent in the equivalent pre-pandemic quarter of Q2 2019.
Spending levels vary considerably by mobile operating system though, and data.ai reports that iOS users typically spend considerably more on mobile games than their Android peers, despite Android accounting for the vast majority of smartphone handsets in use today.
iPhone users accounted for roughly 62 percent of mobile game spending in Q2 2022, with game-related purchases in the iOS App Store reaching USD $13.3 billion, compared with USD $8 billion in the Google Play store.
For context, data.ai reports that consumer spend on mobile apps totalled USD $33 billion across all app categories between April and June 2022.
Meanwhile, a report co-published by data.ai and IDC reveals that gaming is now a multi-generational opportunity, with engagement and spend on mobile games increasing amongst older age groups.
The report’s authors note that retirees in particular may represent a particularly appealing gaming opportunity, thanks to higher levels of disposable income, as well as potentially more free time to play games.
GWI’s research adds valuable context to these findings, with the company’s latest data revealing that roughly two-thirds of Baby Boomers already play video games.
The evolving app economy
Beyond games, mobile users have been spending an increasing amount of money on other kinds of apps.
Indeed, Sensor Tower reports that spending in non-game apps has now overtaken spending on mobile games amongst mobile users in the USA.
But it’s particularly interesting to see where this money is being spent.
As we reported in detail in last quarter’s analysis, TikTok accounts for the largest share of consumers’ spend on mobile apps, eclipsing even the top mobile games.
Other video apps attract high levels of consumer spend too, with data.ai placing another 5 video apps – YouTube, Disney+, Tencent Video, HBO Max, and iQiyi – in the top 10 apps by global consumer spend.
Dating apps also generate significant revenues, with Tinder and Bumble both making the global top 10 by consumer spend.
But data.ai’s analysis reveals that people are spending an increasing amount of money in other mobile app categories too.
Audio books claim one of the standout stories this quarter, with Amazon’s Audible app delivering the largest quarter-on-quarter growth in consumer spend of any mobile app over the past three months.
Data.ai’s “breakout apps” ranking also shows that there has been a significant increase in the amount of money that end users spend within LinkedIn’s mobile app.
Sadly, the data doesn’t reveal what users are spending this money on, but with LinkedIn advertising already earning meaningful revenue for Microsoft, this increase in consumer spend only goes to consolidate the value of its LinkedIn acquisition.
Meanwhile, people have been spending more money on apps to help them enjoy the great outdoors too, with both Strava and AllTrails seeing a meaningful increase in consumer spend during the course of Q2.
The rise of smart wrists
GWI’s ongoing survey of internet users around the world reveals strong growth in the adoption of smartwatches and smart wristbands over recent months.
Data shows that ownership of smartwatches like the Apple Watch has jumped by more than 60 percent over the past 2 years, while ownership of smart wristbands like the Fitbit has climbed by more than 35 percent during the same period.
For perspective, these latest numbers indicate that roughly 800 million adults now own at least one of these devices.
That means that working-age internet users are now 40 percent more likely to own a “smart wrist” device than they are to own a games console, and nearly twice as many people own one of these wearables as own a TV streaming device like an Apple TV.
Wrapping up
That’s all for this quarter’s analysis, but we’ve already started to research the more forward-looking trends that we’ll share as part of our next Statshot report, so be sure to visit DataReportal for that update towards the end of October.
In the meantime, if you’d like some help making sense of what the latest trends might mean for your 2023 plans, you might be interested in our private briefings, which dig deeper into the stories and context behind all of these numbers, and identify the key implications for marketers.
We’ll also be publishing the latest country-level audience data for a selection of the world’s top social media platforms in a couple of weeks’ time, so head over to our dedicated social media pages for those updates starting in mid-August.
That’s all from me for now though – I’ll see you back here in October.