
Digital 2023 Deep-Dive: Is social media really dying?
You’d be forgiven for being confused about the state of social media in 2023.
Alongside the general myth that social media is “dying”, there’s also plenty of misinformation circulating about the popularity of individual social platforms – or lack thereof.
Some of this misinformation relates to unfounded assumptions and poor fact checking, but – increasingly – we’ve noticed a trend towards wilful misrepresentation of the facts too, even by journalists in more reputable media.
So, in this comprehensive article, we’ll examine a broad range of the latest data from a variety of reputable sources, and bring you the unvarnished truth about what people are really doing on social media.
Social media users are still growing
Just before we explore the status of each individual platform, let’s address the overall myth that social media is “dying” with one simple fact: social media users are in fact still growing.
This is a story we explore in detail in our Digital 2023 Global Overview Report, so head over to this article if you’d like to explore that data in more depth.
Suffice to say though, the headlines confirm that social media overall isn’t dying.
But what about individual social media platforms?
That’s a more interesting question.
What’s the world’s top social media platform?
Let’s start with one of the most common questions we hear from brands and journalists alike: what’s the top social media platform in the world?
Frustratingly – as with so many things on the internet – there’s more than one “correct” answer to this question.
So, in the interests of giving you all the inputs you need to make the best informed decision, let’s look at each of those “correct” answers in turn.
Social media platforms: monthly active users
If we rank platforms by the number of monthly active users – which perhaps offers the most consistent basis for comparison – the latest data suggest that Facebook still comes out top.
Figures published in Meta’s Q3 2022 investor earnings report show that the platform has 2.958 billion monthly active users (MAU), which equates to almost 37 percent of the world’s total population.
Meanwhile, YouTube’s latest “official” statement indicates that the platform has “over 2 billion monthly logged-in users”, but figures published in the company’s own advertising resources suggest that the platform now attracts more than 2.5 billion active users each month.
These are the most informative figures we have for active use of these platforms, so these are the figures that we’ve included in our ranking of the world’s most used social media platforms.
However, ad reach and monthly active users are actually quite different metrics, so this isn’t a true “apple-to-apples” comparison.
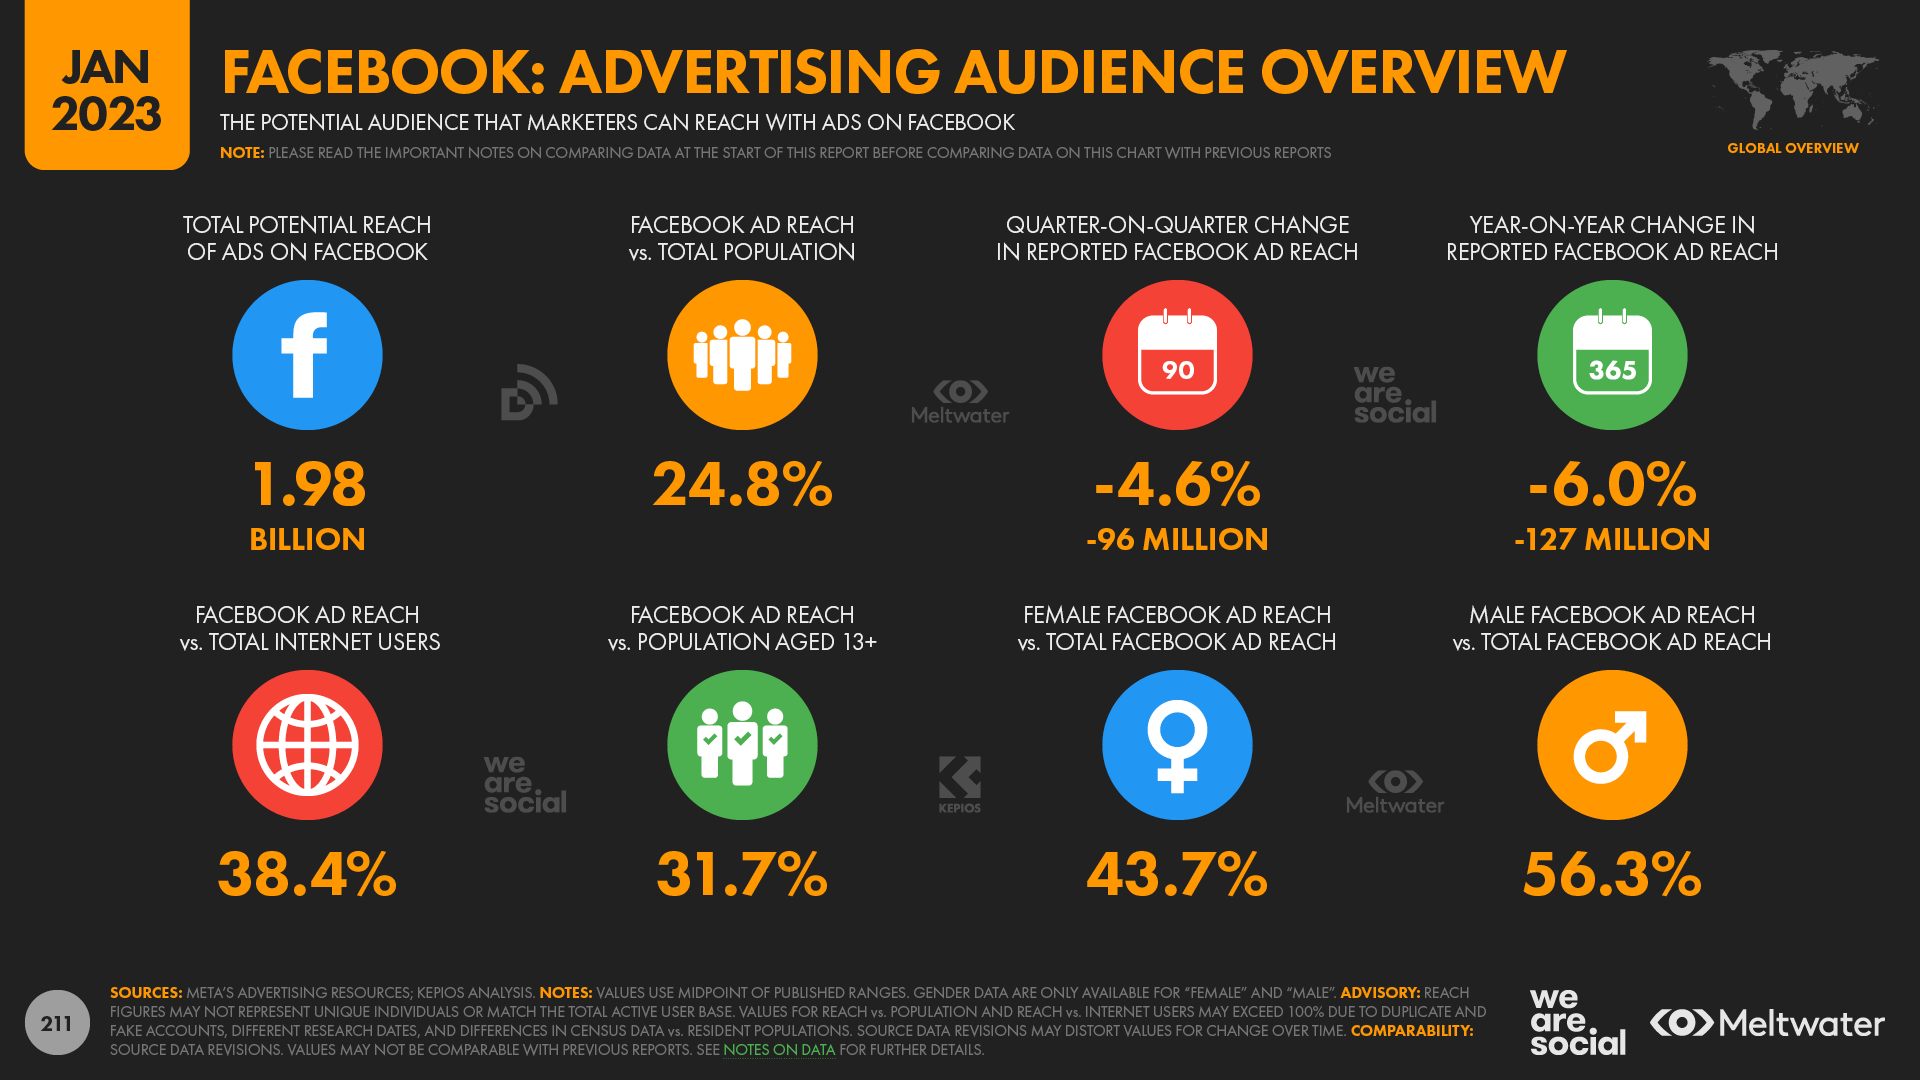
For example, figures published in Meta’s own advertising resources put Facebook’s global ad reach at just 1.983 billion.
In other words, Facebook’s published ad reach figure equates to just 67 percent of its total MAU figure, which would mean that almost a billion monthly active Facebook users don’t see ads each month.
That may seem surprising, but there may be various reasons for this “gap”.
For example, US sanctions prevent the company from selling advertising in certain locations, such as Russia and Cuba.
Furthermore, if a user anywhere in the world were to open the Facebook app and head straight to their notifications tab without scrolling in their newsfeed, there’s a good chance that they wouldn’t see any ads before closing the app.
And as Meta itself states in its own ad planning tools in relation to these ad reach numbers,
“Estimated audience size is not a proxy for monthly or daily active users, or engagement. Estimates aren’t designed to match population, census estimates or other sources, and may differ depending on factors such as: how many accounts across Meta technologies a person has; how many temporary visitors are in a particular geographic location at a given time; and Meta user-reported demographics.”
Each platform has its own nuances too, so we can’t expect trends on one platform to match those on any other.
However, the difference between Facebook’s total MAU figure and its reported ad reach figure suggest that YouTube’s total MAU figure might well be somewhere closer to 3 billion.
And it’s also important to note that YouTube’s advertising resources only show ad-reach data for 80 or so countries around the world.
Those 80-something countries currently account for the vast majority (more than 85 percent) of the world’s internet users outside of mainland China (where YouTube is still blocked), but this still means that YouTube’s published ad reach figures likely under-represent the platform’s total active user base.
It’s tricky to identify how many users YouTube might have in those countries that aren’t included in its ad tools, especially because those countries span the spectrum of digital adoption (and lack thereof).
However, Kepios analysis suggests that users in these “other” countries might well increase YouTube’s global ad reach figure to one that’s either very close to, or perhaps even just above, Facebook’s latest MAU figure.
We prefer to avoid estimates in our Global Digital Reports though, so in our ranking of the world’s most used social media platforms, we only include figures that have been published directly by the respective platform, or – in the absence of recent, “official” figures – by a reputable third party.
But even that “official” data shows that both Facebook and YouTube reach at least 2½ billion active users each month, and that should be more than compelling enough to keep both of these platforms in – or add them to – your social media mix.
I promised you a variety of “correct” answers though, so what do other datasets tell us about global social media use?
The world’s most used mobile apps
In most cases, mobile apps deliver the richest version of each platform’s user experience, and trends in app activity offer some of the best perspectives on social media trends.
So, we’re delighted to have joined forces more closely with data.ai for our Digital 2023 reports, which allows us to bring you even richer insights into what’s really happening in the world of mobile.
Let’s start by looking at the company’s latest intelligence for monthly active use.
Note that the active app use rankings in our Digital 2023 reports are slightly different to the ones that we included in our previous reports though, because we now include pre-installed apps in this dataset (e.g. YouTube on Android devices).
It’s important to acknowledge that pre-installed apps may enjoy an advantage over apps that users must actively download.
However, web traffic data – which we’ll explore in more detail later – suggests that these app rankings are not unduly distorted by the inclusion of these pre-installed apps.
And moreover, regardless of how each app came to be on people’s devices in the first place, the MAU figures only include people who actually open and use each app, so either way, these figures provide an accurate picture of “active use”.
It’s also important to highlight that these rankings don’t include data for China, and rankings are based on average use throughout 2022, not just the most recent quarter.
However, the overall rank order of the 10 most used social media apps hasn’t actually changed during the course of the past year, even if we’ve seen meaningful growth in the respective user figures of many of these apps.
But what does the data actually tell us?
YouTube tops the mobile app rankings
Well, data.ai intelligence reveals that YouTube tops the rankings for monthly active app users, putting it ahead of Facebook.

data.ai’s analysis shows that the MAU figures for both platforms are still growing steadily though, so these figures don’t in any way point to a decline in active Facebook use.
WhatsApp is the third “social” app in this ranking, with the latest MAU figures putting it just behind Facebook.
Meta stablemates Instagram and Messenger claim the remaining “social” places in the top 10 apps by MAU, and it’s worth highlighting that Google and Meta account for all of these top 10 apps.
So what about TikTok?
Perhaps unsurprisingly, the hugely popular short-video platform now ranks sixth at a worldwide level, although it’s worth noting that these rankings don’t include users of TikTok’s sister app, Douyin.
However, the latest figures do reveal quite a big difference in the active user numbers for fifth-ranked Facebook Messenger and sixth-ranked TikTok.
Telegram comes in seventh, ahead of Twitter in eighth place, while Snapchat and Pinterest round out the top ten social media apps by monthly active users.
Absolute user numbers only tell part of the story though, so let’s take a closer look at the time spent using social media apps too.
Time spent using social media apps
Once again, there are a few different ways of looking at this data, but the most insightful analysis comes from looking at total time spent by all users, and average time per user.
When it comes to total time spent using social media apps each month, data.ai’s ranking shows many similarities to its ranking by monthly active users.
However, in the ranking by total time spent, TikTok and Facebook Messenger trade places, while LINE jumps up a few spots to sit ahead of Snapchat.
Due to the commercial value of this data, we can’t show figures for total time spent on each platform, but we can show the rank order, as well as the average time per user for each platform [if you’d like to dig deeper into the full dataset, head over to data.ai].
But those figures for average time per user tell a fascinating story in their own right.
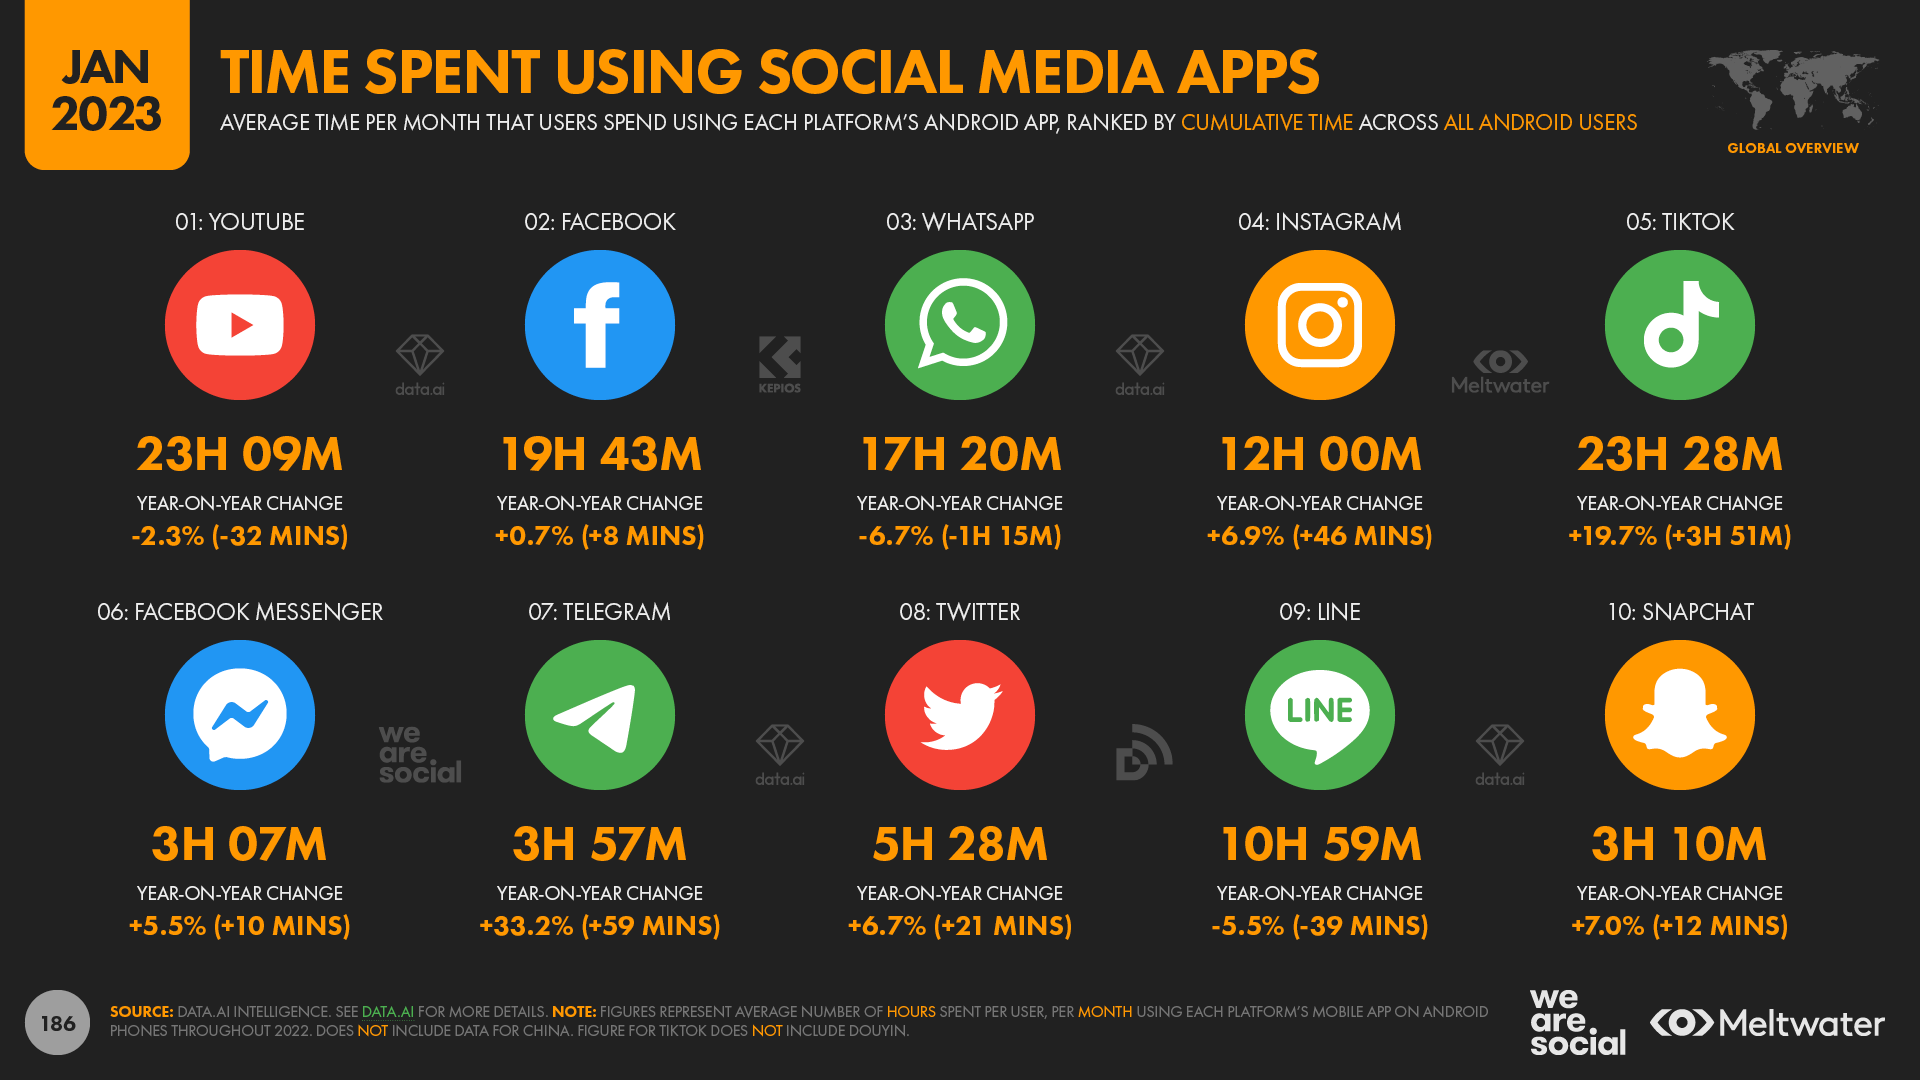
Amongst the world’s most used social media apps, TikTok enjoyed the highest average monthly use per user over the course of 2022.
The short-video platform’s Android app users spent an average of 23½ hours per month using the TikTok app between January and December last year, just ahead of YouTube’s 23.1 hours.

TikTok’s rise to the top of these rankings might not surprise you, but some of the data fuelling its ascendance may still raise some eyebrows.
For example, the platform’s own data shows that posts tagged with #FYP (“for you page”) have now been viewed a total of 35 trillion times – and yes, that really is trillions.
Even if each of those views only lasted for one single second, that would add up to well over 1 million years of combined human existence… and that’s only for videos tagged with #FYP.
But in what might come as another surprise if you’ve been reading the mainstream media recently, Facebook ranks third in data.ai’s figures for average time spent per user, at almost 20 hours per month.
Moreover, data.ai’s intelligence reveals that the average time that Facebook users spend using the platform’s Android app has actually increased over the past year, from an average of 19.6 hours per month, per user in 2021, to 19.7 hours in 2022.
And just for added context, data from Statcounter suggests that Android phones account for 72 percent of all the smartphone handsets in use today.
On the other hand, it’s interesting to note that the typical Instagram user only spends half as much time using the platform as TikTok users spend using TikTok.
Instagram use varies meaningfully from country to country though.
For example, the typical Instagram user in Turkey spends an average of 21.4 hours per month using the platform’s Android app, but in South Korea, that figure is just 6.1 hours per month.
Similarly, despite being the apps that we tend to open most frequently, the world’s social media users tend to spend slightly less time using messenger platforms like WhatsApp and LINE compared with more content-centric platforms like TikTok and YouTube.
Another perspective on total social time
More broadly, Kepios analysis of data.ai’s figures suggests that users themselves may be underestimating how much time they spend using social platforms.
When asked as part of GWI’s survey, the typical social media user says that they spend about 2½ hours per day using social platforms, and that they use an average of just over 7 platforms each month.
However, data.ai intelligence suggests that the daily average figure may be higher than these self-reported figures suggest, potentially because of differences in which platforms people include in their definition of social media.
For example, many people around the world do no consider messenger platforms like WhatsApp, LINE, and KakaoTalk to be “social media”.
However, our analysis of data.ai’s figures suggests that the global average time spent using social media platforms may be closer to 2¾ hours.
An extra 15 minutes per day might not sound like a lot, but added up over the course of a year, that would translate into an additional 91 hours per user, which is about 5½ waking days.
But overall, these mobile app insights reinforce the idea that YouTube and Facebook continue to dominate rankings of the world’s “top” social media platforms.
Don’t worry if you’re still not convinced though, because we still have a few more “correct” answers to explore.
Web traffic to social platforms
The number of visitors that each platform’s website attracts offers another interesting perspective into social media use, especially because web traffic figures include people who haven’t actively logged in to each respective service.
It’s important to note that estimates of web traffic vary meaningfully from one source to another, but the ranking of YouTube and Facebook remains relatively consistent across sources.
For example, Semrush currently places YouTube second in its worldwide ranking of websites, with a total of 5.85 billion unique “visitors” per month, ahead of third-placed Facebook’s 2.48 billion.
It’s important to stress that these figures don’t represent unique individuals though, because – in this context – “visitors” is more akin to “devices”.
Indeed, given that YouTube’s 5.85 billion figure exceeds the total number of global internet users (5.26 billion), there’s inevitably some duplication in there.
That duplication is to be expected though; the latest data from GWI indicates that the typical internet user around the world goes online using an average of 2.7 different devices.
But even if we allow for this average number of devices, data still suggests that YouTube’s website may attract in excess of 2 billion unique individuals per month.
Similarweb offers quite different figures to those offered by Semrush, but the outcome is the same: YouTube ranks second with 1.94 billion unique monthly visitors, while Facebook ranks third with 1.61 billion.
These web traffic figures don’t include data for mobile app usage, which – as we saw above – likely accounts for the majority of social media activity.
However, web traffic includes valuable perspectives on different kinds of platform usage – especially more “casual” visitors who don’t log in to the respective service.
The social web
As we explored in detail in our Digital 2022 October Global Statshot Report, there’s plenty of evidence to suggest that people are increasingly consuming social content from within web browsers, in addition to using those platforms’ mobile apps.
We’ve already seen that YouTube and Facebook rank amongst the world’s most visited websites, but various other social platforms appear in these top rankings too.
Instagram is another popular web favourite, and the latest figures show that the platform’s .com domain attracts in excess of 1 billion unique visitors each month.
But the implications of this trend for Twitter are particularly important, because our analysis of various data points suggests that Twitter may see more users on its website than it does in its mobile apps.
Indeed, this quirk in Twitter use is so interesting that we’ve produced a whole separate study on the subject, and you can read that full article here.
But it’s not just Twitter that sees high volumes of traffic to its website; a similar pattern is also visible in global Reddit use.
Much like Twitter, Reddit only seems to report a small subset of users in its “official” metrics.
For reference, Reddit’s most recent reported value is 50 million “daily active uniques”, but the company hasn’t updated this figure in more than two years.
However – despite markedly different unique visitor figures – both Semrush and Similarweb report that Reddit.com is one of the world’s 20 most visited websites.
These findings suggest that Reddit’s “official” figures significantly under-represent its true audience size, and therefore perhaps the platform’s potential value too.
So, as with Twitter, marketers would do well to explore Reddit’s potential beyond just its advertising products, in order to understand how they can tap into the true potential that this rich community has to offer.
Meanwhile, TikTok’s web domain is also gaining momentum.
Semrush places TikTok.com in 18th position at a worldwide level based on traffic between September and November 2022, with close to 1 billion unique monthly visitors.
The platform doesn’t quite qualify for Similarweb’s ranking for 2022 as a whole, but the company’s latest analysis suggests that TikTok.com was the 19th most visited domain on the web in December 2022, suggesting that traffic has increased meaningfully over the past twelve months.
It’s also interesting to note that web searches for “WhatsApp” and “WhatsApp Web” continue to grow, with both terms seeing worldwide search volumes more than double over the past five years.
Indeed, Google search volumes for “WhatsApp Web” appear to have increased by more than 500 percent since early 2018, suggesting that use of the messenger’s browser-based interface has grown substantially over recent years.
But seeing as our original question was, “what’s the world’s most used social media platform?”, it’s worth reiterating that this traffic data shows – once again – that YouTube and Facebook are the top performers in when it comes to the “social web”.
Just before you make your final call on the world’s “top” social platform though, let’s explore an additional dataset, which offers a different set of findings.
The world’s favourite social media platform
All of the data that we’ve explored so far relied on active use of each social media platform, but that data doesn’t tell us about users’ affinity for each platform, or where those platforms fit in their everyday lives.
Fortunately though, GWI’s excellent data allows us to explore this perspective.
Just before we get into the data, it’s essential to highlight that GWI treats YouTube as a video platform rather than a social media platform, so YouTube doesn’t appear in GWI’s “favourite social platform” dataset.
However, this dataset still reveals some fascinating insights.
First of all, despite only ranking third in terms of total active users, WhatsApp is currently the world’s “favourite” social media platform.
Each person may interpret “favourite” differently of course, so do note that there’s inevitably a degree of subjectivity in these rankings.
However, that subjectivity is also an important component of how each individual feels about each platform, so subjectivity actually adds value to this dataset, rather than detracting from it.
Instagram and Facebook continue their ongoing dance for second spot in the rankings, although their respective shares of worldwide votes are still almost identical.
WeChat – also known as 微信, or “Weixin” in Chinese – ranks fourth at a worldwide level, demonstrating not only the sheer scale of China’s internet population, but also the continued appeal of Tencent’s flagship superapp.
Just for added context though, our analysis of various datasets reveals that the vast majority of WeChat users are still located in mainland China.
But in something of a surprise given the way it’s been portrayed in the media recently, just 6.1 percent of the world’s working-age social media users say that TikTok is their favourite platform, which is only good enough for fifth place in this latest ranking.
However, it’s worth highlighting that TikTok’s share of the vote has jumped by a healthy 42 percent (+1.8 percentage points) since this time last year, so the platform’s popularity is clearly in the ascendant.
But I’m sure you’re wondering whether this overall ranking represents the views and feelings of younger users too, so – for the penultimate dataset in this article – let’s explore how social media preferences vary by demographic.
Social media preferences by age and gender
And in what might come as another surprise, GWI’s data reveals that Instagram remains the “favourite” social media platform amongst internet users aged 16 to 24.
For context, TikTok’s popularity continues to increase, and GWI’s data reveals that the number of women aged 16 to 24 who identify the short-video service as their “favourite” social platform has jumped by more than a third over the past year.
However, the same data reveals that almost twice as many women in this age group still choose Instagram as their “favourite” platform compared with TikTok (23.1 percent versus 12.0 percent, respectively).
Young men are even more likely to choose Instagram over TikTok, but – in perhaps the biggest surprise in this dataset – men aged 16 to 24 are also more likely to cite Facebook as their favourite social platform than they are to choose TikTok (10.5 percent versus 7.7 percent, respectively).
It’s also interesting to note that WhatsApp ranks second amongst this age group, with both young women and young men putting the world’s favourite messenger platform ahead of TikTok.
WhatsApp tends to dominate amongst older users too, especially for men.
However, this dataset offers yet another resolute contradiction to the idea that Facebook might be “dying”.
Indeed, the fact that so many of the world’s social media users – across all ages – tell us that Facebook is still their favourite social platform is more than enough evidence to counter the baseless click-bait.
The story so far
So there you have it: possibly the most comprehensive analysis of social media user numbers and preferences that you’ll find anywhere in the world today.
But after all that data… which platform comes out top?
Well, the answer to that question actually depends on you, and what you’re trying to achieve.
The best counsel I can offer here is that absolute rankings are rarely the ideal place to start when it comes to crafting a marketing plan, because your brand’s needs and the specific behaviours of your audience are far more important than which platform comes out “top” in these rankings.
Indeed, overall reach numbers can often be a distraction, because they invariably include large numbers of people who are outside the audience that you’re hoping to reach and engage.
But the good news is that we have one last dataset to explore in this article, and the insights it offers should help you to make better informed decisions as to which social media platform(s) to prioritise in your 2023 plans.
Social media choices are not a zero-sum equation
For me, one of the most valuable charts in our Global Digital Reports explores the overlaps between social media audiences.
I’ve talked about this chart in many of my recent analyses, but we’ve enhanced the methodology that we use to identify these overlaps in our Digital 2023 reports, so the findings in this latest dataset are even more representative than before.
And the key finding here is that we actually under-represented audience overlaps in our previous reports.
Indeed, Kepios’s latest analysis of GWI’s excellent data reveals that barely 1 percent of the users of any given social media platform are actually unique to that platform.
GWI’s data suggests that YouTube has the “largest” unique audience of any of the platforms in our analysis.
However, just 1.0 percent of YouTube’s working-age users say that they don’t use any other social media platform, so “large” might not be the most appropriate word to use in this context.
Moreover, it’s worth highlighting that questions about YouTube appear in a different part of GWI’s survey compared with the other platforms in this list, and were the video platform to appear alongside all of the other choices, there’s a chance that this 1 percent figure might be even lower.
Indeed, no other social platform can claim even 1 percent unique reach versus other social media platforms, and in many cases – including TikTok, Snapchat, and Twitter – just 1 in every 1,000 users is unique to that platform.
Platform choices are not binary
But looking at the same data another way, this audience overlaps chart also debunks the widely circulated myth that people are “abandoning” old favourites for newer social media platforms.
For example, amongst worldwide users aged 16 to 64:
82.5 percent of TikTok users still use Facebook every month;
84.3 percent of Telegram users also use WhatsApp every month; and
60.7 percent of Snapchat users also use Twitter each month.
So, don’t get distracted by click-bait and poorly researched headlines; the clear takeaway from this data is that people still use a wide “portfolio” of different social media platforms each month.
Indeed, GWI’s data shows that the typical user makes active use of 7.2 social media platforms every month, and that figure is even higher amongst younger age groups.
But the findings arising from the platform audience overlaps data also have some more profound implications for marketers.
Critically, if you’re hoping to increase your potential reach, there’s actually no benefit to be gained by trying to be on all social media platforms at the same time.
Indeed, a presence on just one or two of the top platforms will deliver almost all of the reach you need.
For example, a mix that included Facebook and YouTube would have the potential to reach more than 9 in 10 working-age internet users outside of China every month.
And considering that these two apps have the greatest unique audiences amongst ad-supported social platforms, you’ll see exceptionally high levels of duplication with each additional platform that you add to your mix beyond these two.
However, that doesn’t mean that Facebook and YouTube should be your only choices.
These findings only relate to increasing potential reach, but reach is only one of the metrics you should consider when building a social media portfolio or media mix.
But the good news is that these overlaps should also make it easier for you to choose the optimum platforms for your needs.
Put simply, activity on one or two of the largest platforms will ensure that you’ve “ticked the reach box”, enabling you to choose some of the smaller, more niche platforms for different kinds of creative opportunity, or perhaps to enjoy lower ad costs.
Remember: with people using an average of more than 7 platforms each month, you have a variety of different opportunities to reach and engage people in social media.
So, as much as your resources allow, my tip would be to embrace that variety, and aim for different outcomes across different platforms.
Next steps
Hopefully all of that data and analysis has given you more confidence to explore broader options for your next social media plan, but if you’re still not sure how to prioritise, you might benefit from our in-depth Quarterly Digital Briefings (note that this is a paid service).
And just in case you’re still in the mood for exploring the numbers, I’d recommend checking out our complete Digital 2023 Global Overview Report, which is packed with all of the latest trends and insights into the world’s digital behaviours.
Disclosure: Simon Kemp is a brand ambassador for GWI and data.ai
Click here to see all of Simon’s articles, read his bio, and connect with him on social media.