
Digital 2016: Global Digital Overview
Today, we’re very excited to share our huge new Digital in 2016 report: a comprehensive study of digital, social and mobile use around the world, produced in partnership with We Are Social.
Let’s dig into all that data…
The headlines
We’ve reported impressive growth in most things digital every time that we’ve published this report, but this year we’re seeing even faster growth – a somewhat surprising result considering that global internet penetration is already approaching 50%.
The key statistics for digital, social, and mobile media in 2016 are:
3.42 billion internet users, equaling 46% global penetration;
2.31 billion social media users, delivering 31% global penetration;
3.79 billion unique mobile users, representing 51% global penetration;
1.97 billion mobile social media users, equating to 27% global penetration.
As we mentioned above, it’s the pace of change that really caught our eye this year. It’s worth noting that the jump in internet users may be partly the result of improved reporting, rather than representing absolute growth in user numbers. We’ve also managed to obtain reliable numbers for social media in countries where previously we had no data, but the overall growth story is still highly compelling despite these caveats.
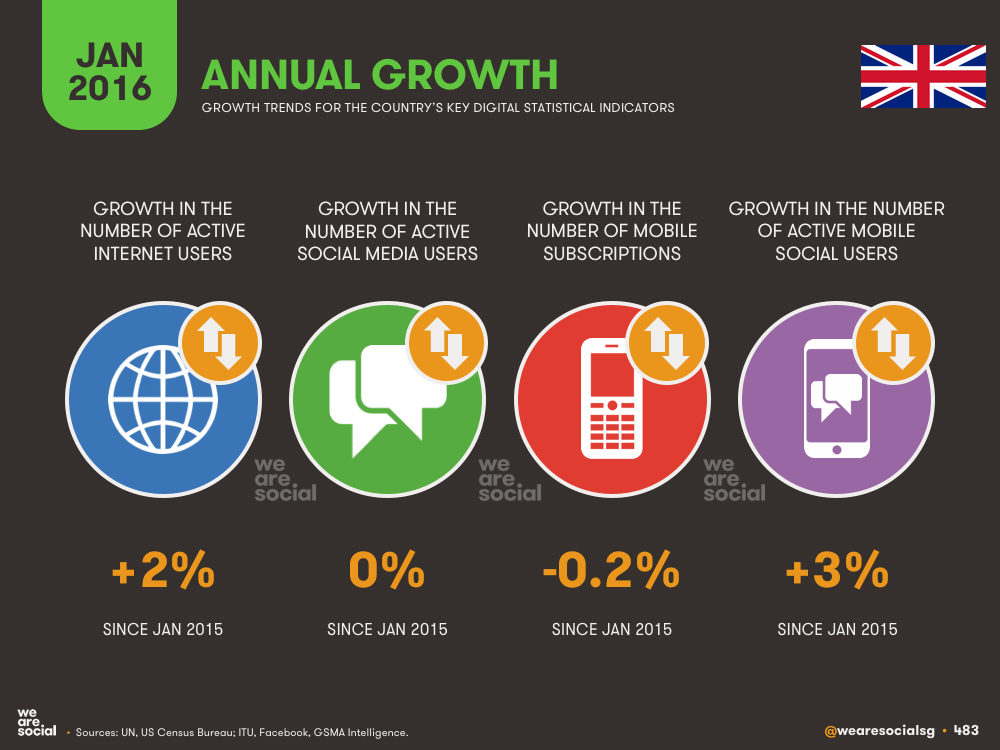
So, just how fast have the numbers been growing since our 2015 global report last January?
The number of reported internet users is up by 10%, growing by 332 million;
The number of reported social media is up by 10%, an increase of 219 million;
Unique mobile users increased by 4% thanks to 141 million new users;
Mobile social media users leapt 17%, adding 283 million new users.
We’ve focused on that last data point – i.e. the growth in mobile social users – as the key theme in our reports for the past two years, and it seems clear that it’s the stand-out number again in this year’s report too. However, the story this year is slightly different, and perhaps more significant, as we’ll see a bit later in this document (see the Mobile Social section).
There have been a few drops in the numbers too, though; a number of individual countries have registered lower mobile connections, possibly because of device and connection consolidation as people upgrade to data-connected smartphones that allow them to use mobile messaging, thus freeing them from the need to operate multiple mobile subscriptions in order to benefit from cheaper intra-network calls and SMSs.
A few countries have also registered falls in Facebook usage, especially in Africa. Notable drops include the Central African Republic, where Facebook monthly active users are down 30% year-on-year, Western Sahara (down 24%), and Zimbabwe (down 16%). Outside of Africa, Monaco’s active Facebook user base is down 15%, whilst Serbia lost 10% of its Facebook audience since last year’s report.
Internet use
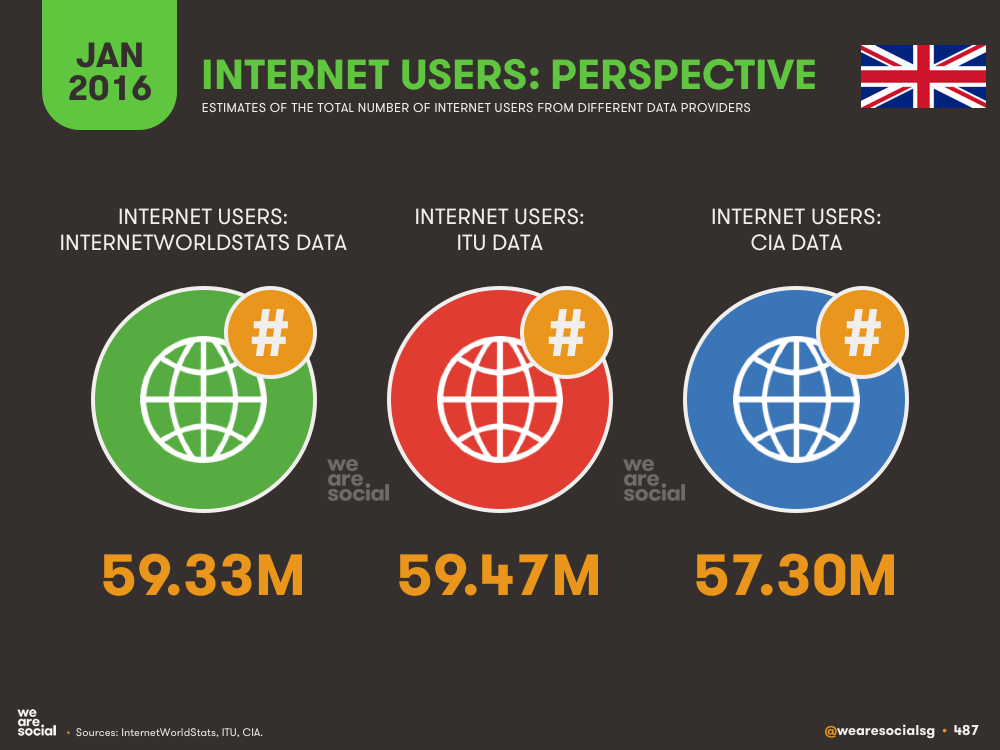
We’ve spent a lot of time over the past few years looking for reliable internet user data, but we still haven't found a single source of free data that meets all our expectations in terms of accuracy and recency. As a result, we’ve opted to ‘manually select’ data from across our more trusted sources for this year’s headline internet user figure, but we’ve also included three different estimates for the 30 countries we feature in the main report, to allow you to make your own informed choices.
It’s also worth noting that some countries still report lower internet user figures than social media user figures (see Note 1 at the end of this document for more context on this). In some instances, notably for countries where no internet user figures are available, we’ve opted to use active Facebook account numbers as a reliable proxy for internet users, but for those countries in our Key 30 Economies (as featured in our Digital in 2016 report) where we make more than one source of internet user data available, we've opted to leave the lower internet numbers as-is, to allow you to make your own choice as to which numbers are most reliable and representative.
The changes to our data sources for these headline figures may be one of the reasons why the number of internet users has gone up so much this year, but we’ve also noticed that our two main data providers – InternetWorldStats and the ITU – have both made significant updates to their databases in the past 12 months, resulting in much more recent data, which we believe is the main driver behind this.
As we see every year, the evolution of internet use is not evenly distributed around the world. The pace of change is greatest in the Middle East, where the number of reported internet users grew a whopping 17%, up more than 21 million users in just twelve months.
Meanwhile, perhaps unsurprisingly, APAC registered the largest absolute growth in internet user numbers – up nearly 200 million users – which translates to an impressive 12% year-on-year growth. At that pace, APAC saw half a million people use the internet for the fist time every single day in the past twelve months – that’s six new users every seconds.
In terms of individual country rankings, Iceland comes in first place for countries with populations of 50,000 people or more, registering 98% penetration. Bermuda and Norway are close behind, with 97% and 96% penetration respectively.
At the other end of the scale, North Korea suffers from the lowest internet penetration worldwide, with barely 7,000 people reported to be able to access the internet. However, given that there is no internet service provider in North Korea, our understanding is that this internet user figure is derived from the number of Facebook users accessing the platform from North Korea, almost all of whom will be foreign nationals accessing via mobile devices.
Many countries in Africa still suffer from woeful internet access rates too, with Niger and Chad coming in second- and third-to-last places with just 2% and 2.5% penetration respectively.
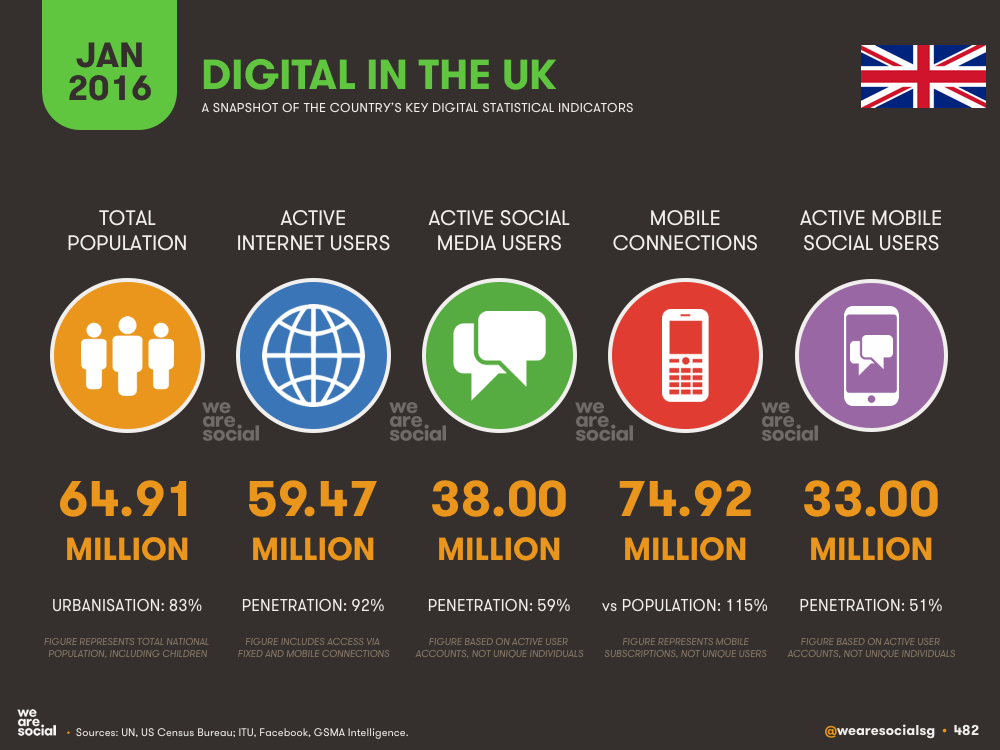
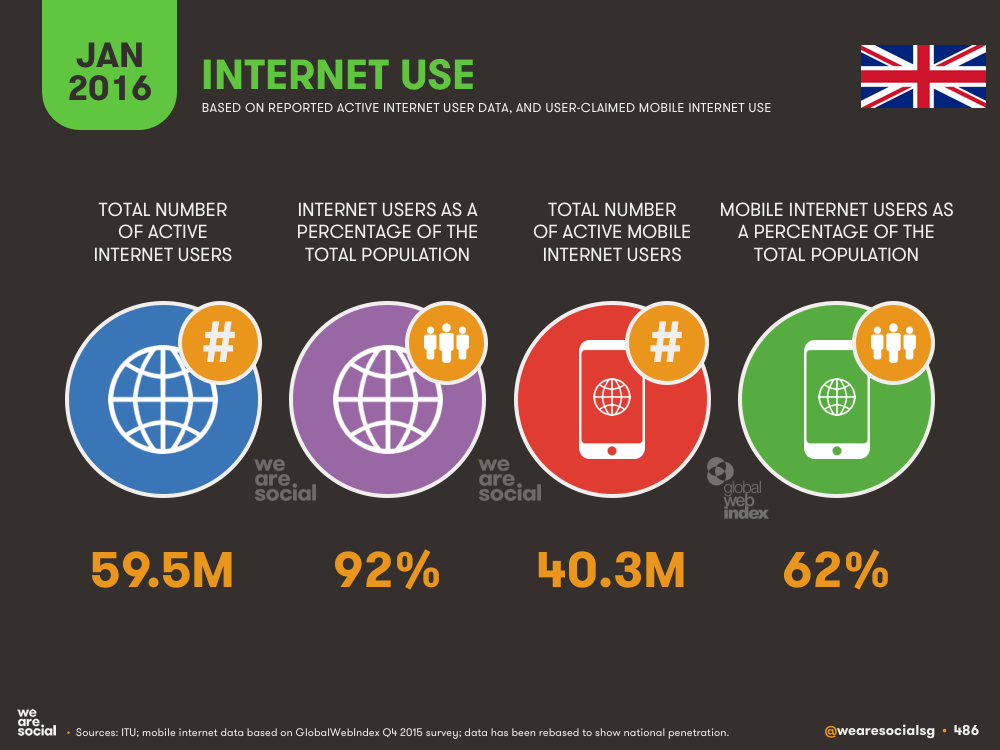
Amongst our ‘Key 30’ economies (i.e. those featured in-depth in our Digital in 2016 report), the United Arab Emirates comes in top at 96%, followed by the United Kingdom (92%) and Canada (91%). India and Indonesia sit at the lower end of the scale with 28% and 34% internet penetration respectively, but they’re the only 2 countries in the Key 30 that fall below the global average of 46%.
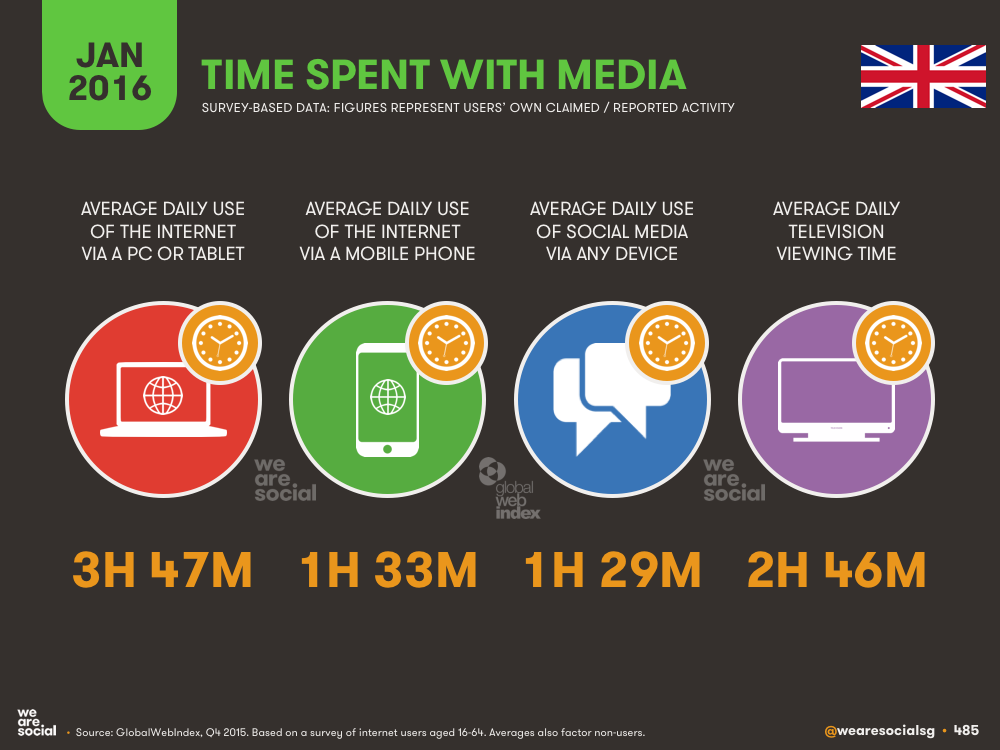
Amongst our Key 30 economies, Brazilians and Filipinos spend the most time using the internet, clocking in at an impressive average of 5.2 hours per day. Together with Thais, the Brazilians also top the list for the amount of time spent using mobile internet, registering an average of 3.9 hours per day.
As we’ve seen for the past few years, and perhaps counter-intuitively, the Japanese and South Koreans spend the least amount of time on the internet each day compared to the rest of the Key 30, at just 2.9 and 3.1 hours respectively.
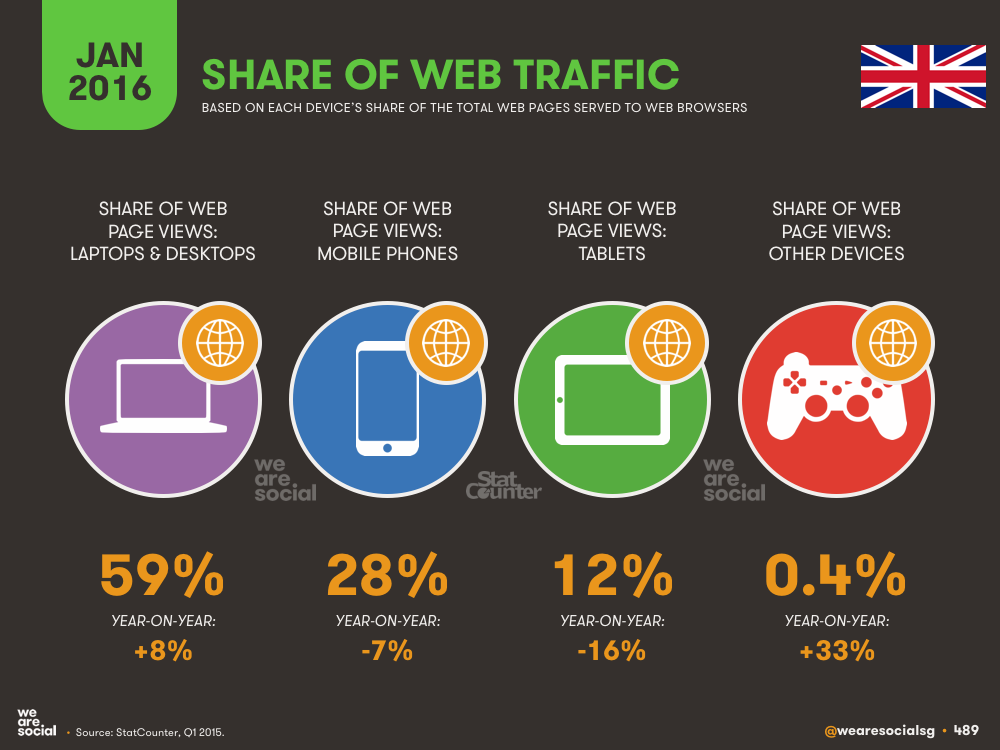
Meanwhile, mobile’s share of global web traffic continues to grow, with StatCounter reporting that mobile phones now account for 39% of all web pages served to web browsers.
However, we also noticed an interesting shift back to desktop and laptop use amongst a number of individual countries this year. These stats are based on web pages served to web browsers, so there may be a variety of reasons for this drop, including increased use of apps instead of web browsers on mobile phones, or an increase in more ‘complex’ web surfing activities (e.g. e-commerce).
Nigeria tops the list of Key 30 economies when it comes to mobile’s share of web traffic, with more than 80% of all web pages served in Africa’s most populous nation going to mobile phones. At the other end of the scale, just 12% of Russia’s web traffic goes to mobile phones – more than three times lower than the global average.
Internet connection speeds continue to improve too, although the pace of change is still painfully slow in many developing nations. Once again, South Korea claimed top spot in Akamai’s rankings for the world’s fastest average speeds for fixed internet connections, registering an impressive 20.5Mbps – a full 33% faster than second-place Hong Kong. Egypt, Nigeria, India and the Philippines all struggle at the other end of the scale though, each with an average connection speed below 3Mbps.
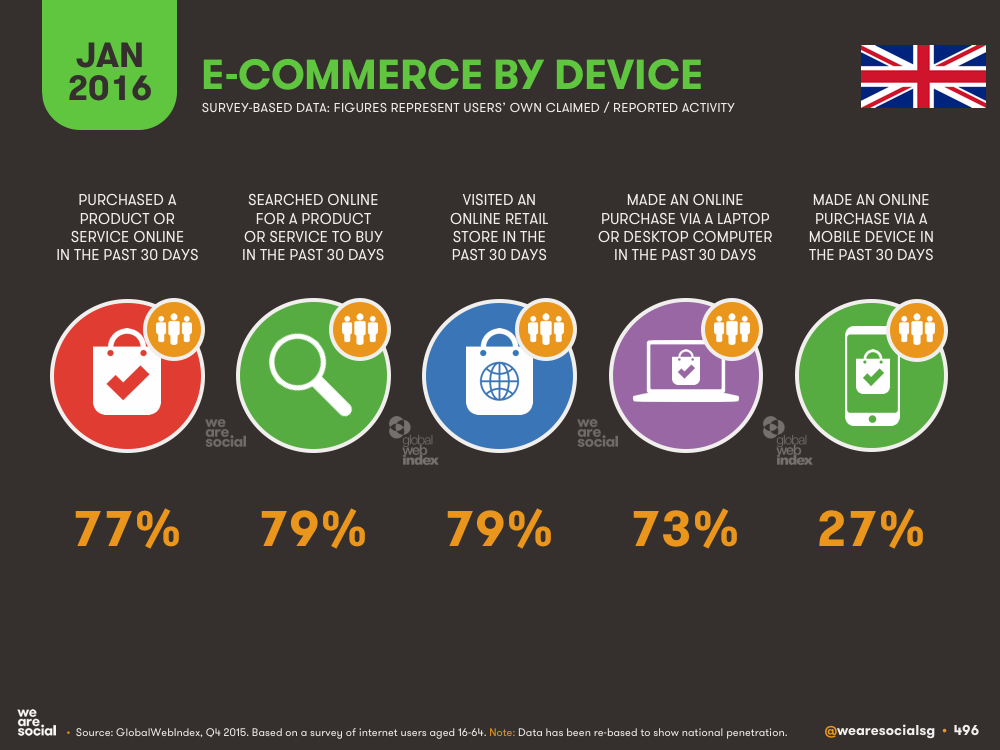
Perhaps in part thanks to these improving speeds, E-commerce use has also surged in the past twelve months, with GlobalWebIndex data indicating that at least 25% of the national populations of all of our Key 30 economies except India made an online purchase in the past month. The UK tops the list, with more than three-quarters of the country’s population making at least one purchase on the internet last month.
Social media use
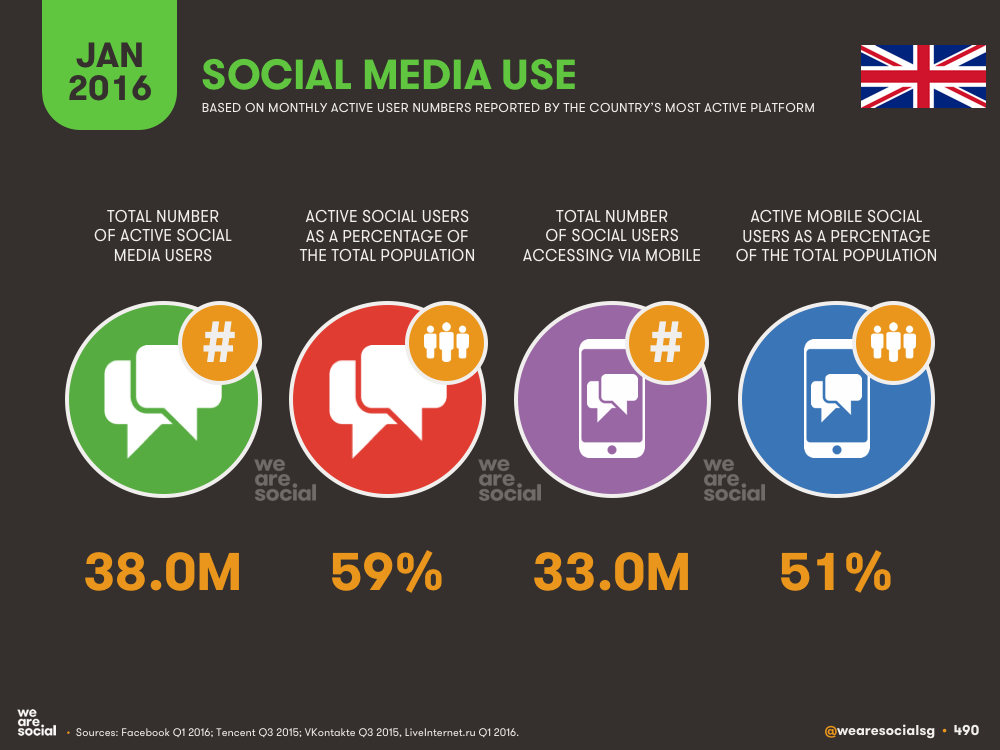
Nearly one-third of the world’s population now uses social media, with the number of reported users around the world jumping an impressive 10% in the past twelve months (see Note 2 below for more information on how we calculate these numbers).
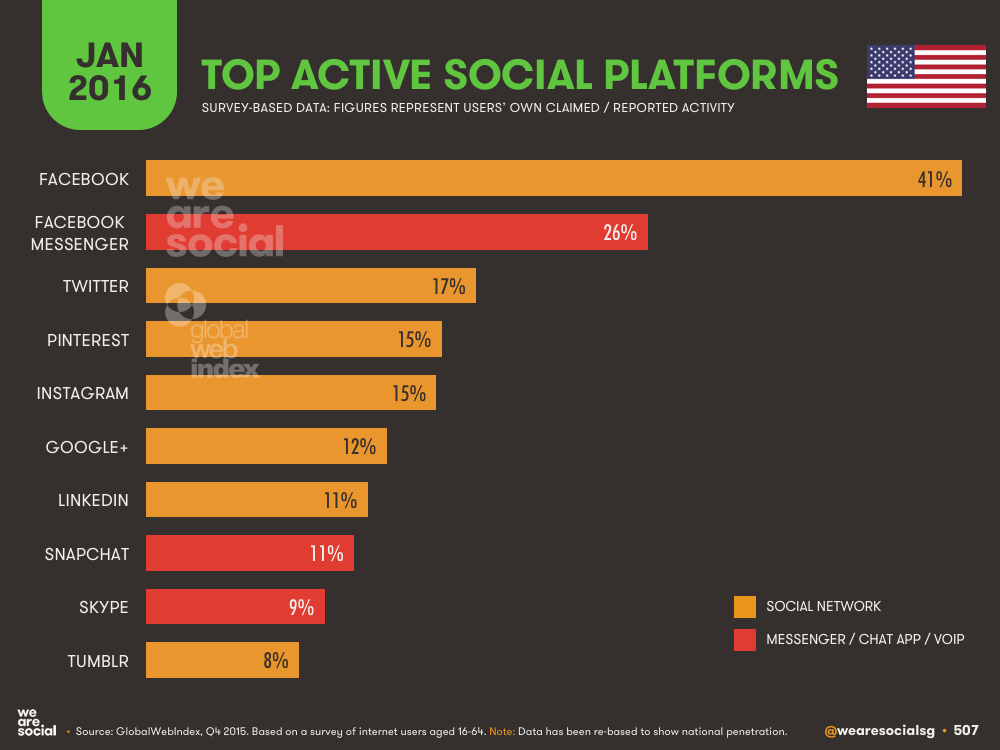
North America sees the highest levels of penetration at 59%, whilst more than half of the total population of South America uses Facebook each month. What makes this figure even more impressive is that our penetration figures include people below the age of 13, who are too young to use Facebook.
Despite some modest gains this year, Central and South Asia still suffer from low social media usage, at 6% and 11% respectively.
When it comes to individual territories, Taiwan achieves this year’s ‘most social’ award, with 77% of the total population using Facebook in the past 30 days. South Korea comes in at number two, with 38.4 million of its total 50.4 million population using KakaoTalk each month.
At the low end of the scale, North Korea comes in last place again, with just 6,800 users out of a total population of more than 25 million. However, this is probably unsurprising given that there are no internet services providers in the reclusive North-Asian state. Turkmenistan comes in second-to-last place, registering just 0.2% for social media use.
Filipinos spend the most time on social media out of our Key 30 economies, clocking in more than 3.5 hours per day. At the other end of the scale, the Japanese spend an average of less than 20 minutes per day on social media.
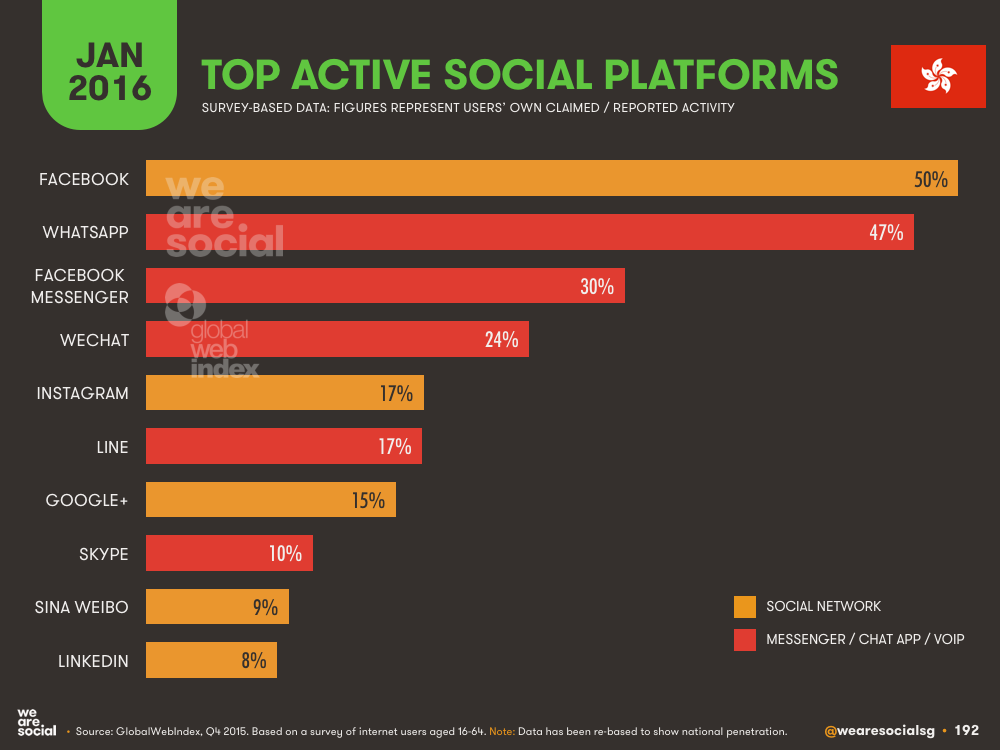
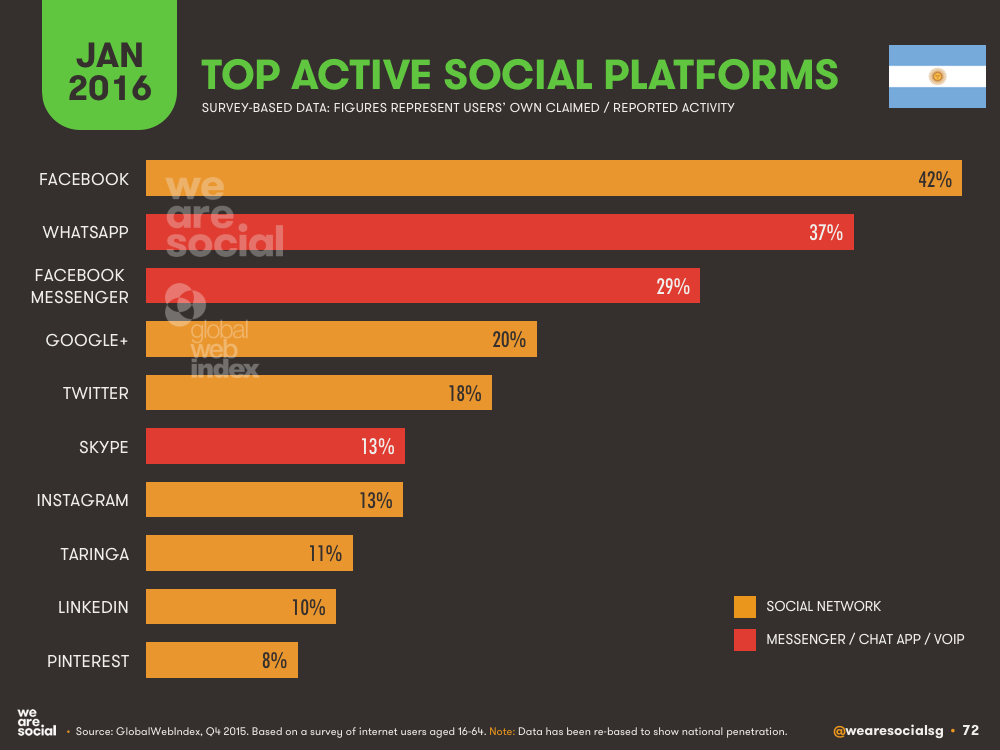
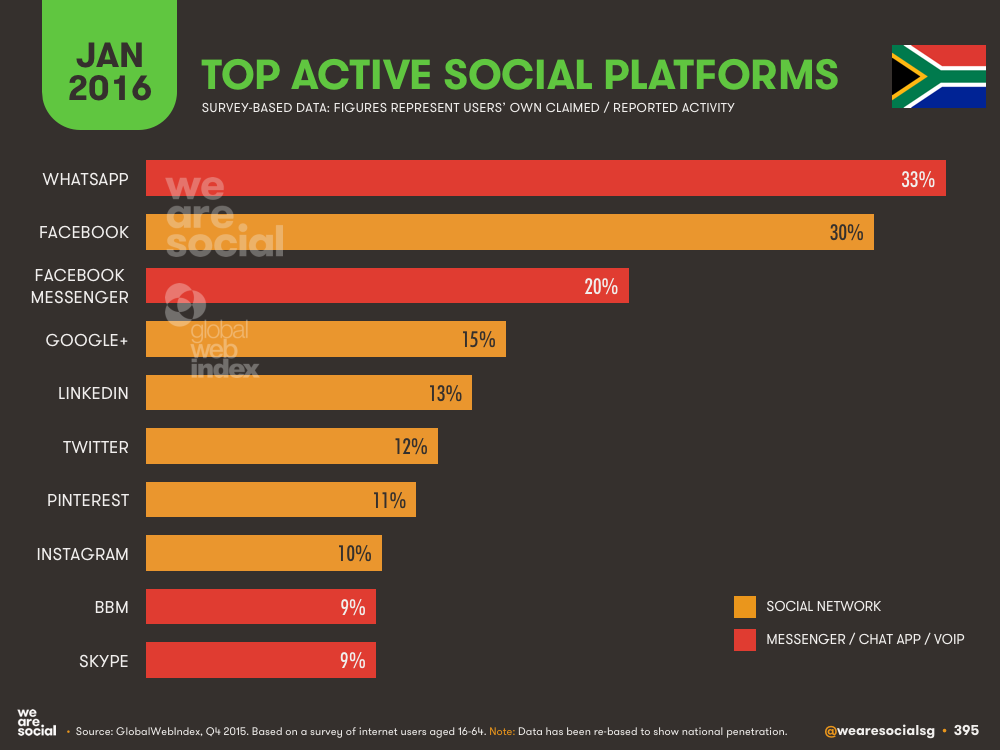
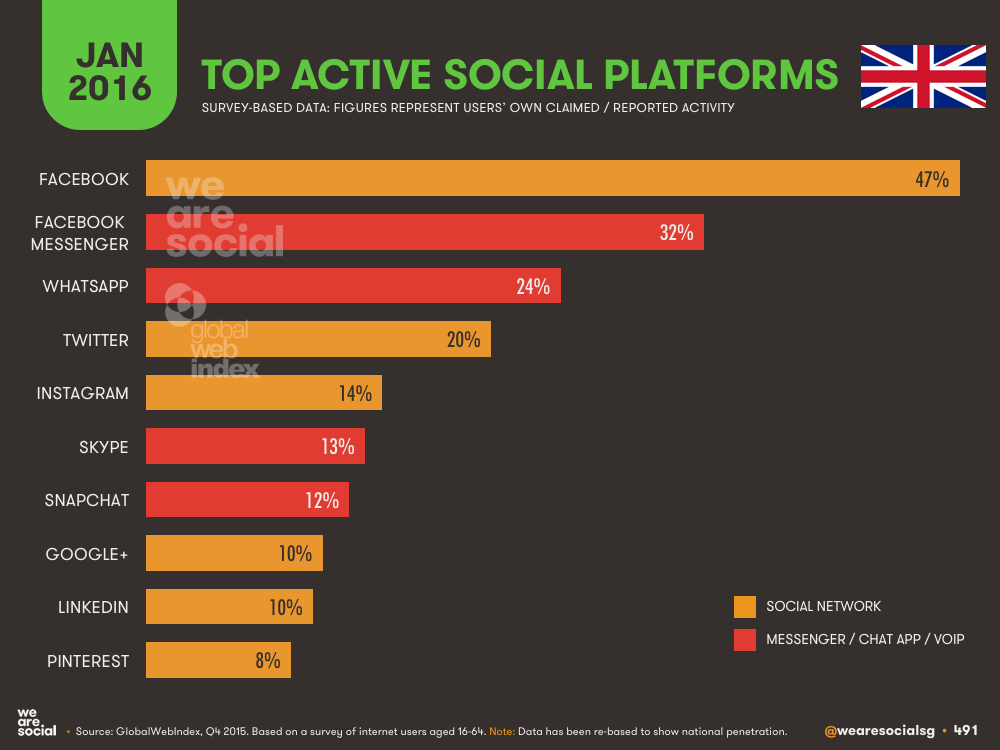
Facebook continues to dominate the global social platform rankings with more than 1.5 billion active accounts, but one of the company’s other offerings, WhatsApp, grew a staggering 50% in the past year, and we fully expect to see the world’s most popular messenger platform pass the 1 billion users mark sometime in the next few weeks. Indeed, data from GlobalWebIndex suggest that WhatsApp is already ahead of Facebook in a number of markets, and trends suggest this will occur on a more frequent basis through 2016.
Meanwhile, the company's other chat platform – Facebook Messenger – continues to grow too, with the team announcing that the app had surpassed 800 million active users just a few days ago, so we’re likely to see a more diverse social landscape in the coming months as people’s habits broaden beyond the Facebook heartland.
It’s not all just about Facebook though. China’s social world continues its love affair with Tencent, with the company’s QQ messenger platform growing slightly to register 860 million active accounts last quarter. However, our understanding is that many people continue to operate two or more QQ accounts, so these numbers cannot be used to represent social media penetration.
However, the good news for Tencent is that two of its other platforms, QZone and WeChat, continue to grow too; both platforms reported roughly 650 million monthly active users each in the past quarter. WeChat (or Weixin) will likely overtake QZone this quarter too, so keep an eye open for Tencent’s next round of results in February.
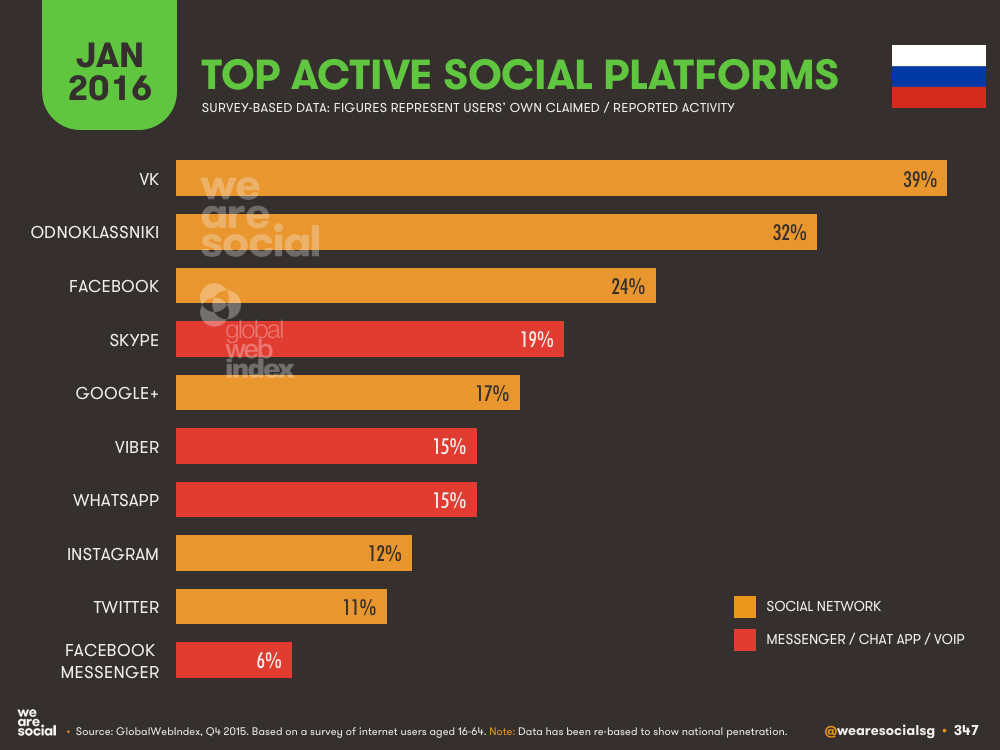
Outside of China, Facebook’s offerings dominate all except a few countries; VKontakte is still top in Russia and a few of its neighbours, although our understanding is that mobile messenger apps are vying for the top spot outside of the Russian platform’s homeland.
LINE’s popular messenger platform dominates in Japan, achieving roughly 42% national penetration, whilst KakaoTalk dominates in South Korea with a whopping 76% penetration.
Taking a more global perspective, this year’s other break-out social growth stories came from Tumblr and Instagram. Our understanding is that many of these additional Tumblr users may be ‘passive consumers’ rather than regularly active posters, but Instagram’s 400 million monthly active users present a compelling case for such a simple, focused platform.
We’ve also managed to uncover reliable social media usage stats for a number of countries that have previously been ‘blanks’ in our dataset. Facebook still doesn’t report figures for Iran, but our understanding is that Telegram now tops the social platform rankings in the country, with research from Niki Aghaei indicating that the popular messenger app now has 15 million active users in the country. Niki also reports that Instagram is hugely popular in Iran, so there’s good news for Facebook Inc. too. If you’re looking for more great insights on social and digital Iran, you might want to follow Niki on Twitter: @nikiness.
We also found some interesting research from BBG that suggests Facebook already has a strong presence in Cuba, despite being officially ‘blocked’ in the country. However, with the thawing of relations between the US and Cuba in recent months, we’re hopeful that people in Cuba will soon enjoy unrestricted access to all forms of social media, and we’re looking forward to reporting a full set of numbers in next year’s report.
And if you’d like to know exactly how social usage plays out in the 229 counties around the world for which we have data, you’ll find all the headline numbers in this year's companion report – the 2016 Digital Yearbook – which we’ve embedded below (see the Individual Country Data section).
Mobile social media use
Given KakaoTalk’s dominance in South Korea, it’s perhaps unsurprising that the country tops the global rankings for mobile social media usage. Qatar comes in at second place, with two-thirds of the nation’s population using social media via mobile devices every month.
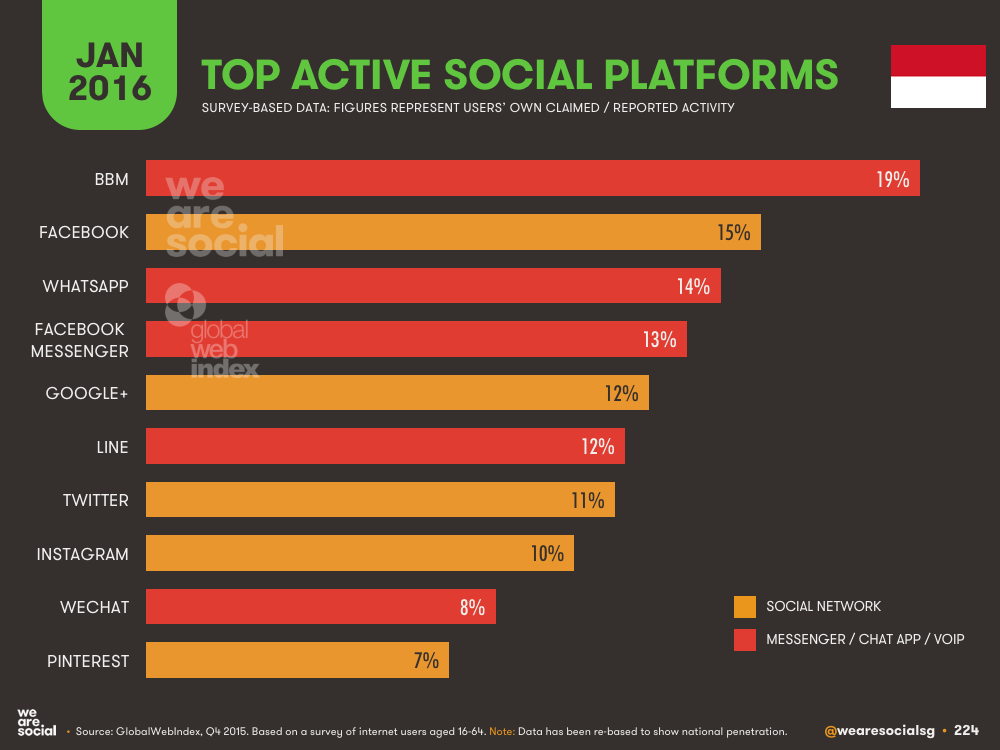
More than a quarter of the world’s mobile social media users live in one region: East Asia. This is partly thanks to the sheer size of China’s population, but it’s also partly due to the peculiarities of infrastructure in Asia-Pacific. Mobile social media is dominant in Southeast Asia too; Indonesia, Malaysia, the Philippines, Thailand and Vietnam are all ‘mobile first’ nations when it comes to internet and social media access.
85% of Facebook’s audience now connects via mobile phones, with 83% accessing via smartphones, and 2% via feature phones. This represents a significant change from just 9 months ago, when just 69% accessed through smartphones, and 26% used Facebook from a feature phone. Globally, just over half of all Facebook users are 'mobile only’, meaning they never use a computer to access the platform.
Although mobile social media usage and growth has been a key story in our reports for the past few years, our sense is that things have changed in a more profound way this year. Together with factors such as adoption of smartphones and improved mobile broadband connectivity (see below), it’s clear that mobile phones are now most people’s ‘primary’ day-to-day device. Mobile may still not beat desktop and laptop computers when it comes to traffic served to web browsers, but that data is often skewed by ‘heavy’ users, and it doesn’t factor data connectivity via mobile apps.
As a result, for the majority of individuals around the globe, a mobile phone is now the main way they access connected services, including the internet. This has been something we’ve been anticipating for a while, but this shouldn’t alter the fact that this is a fundamental shift in the way people access and consume information and content.
With specific reference to mobile social media usage, the shift towards mobile messengers will have the most profound implications for marketers. Perhaps with the exception of WeChat, platforms such as WhatsApp, LINE, KakaoTalk and Facebook Messenger are largely ‘private’ experiences, with little (if any) information visible to strangers.
These changes are already having an effect on other platforms too; we’re seeing an increased number of ‘private’ accounts on Instagram – especially amongst Millennial users – and people are sharing fewer ‘personal’ stories on public channels like Facebook and Twitter too.
This evolution in user behaviour requires a fundamental change of mindset for marketers too. In this new social reality, we’ll need to rethink the ways we go about connecting with our audience, especially as those people spend less time in public channels and more time in one-to-one environments like chat apps.
Importantly, however, this doesn’t mean that we should give up on ‘conversation’ in favour of using social channels as a delivery mechanism for more passive content.
Whilst such ‘snackable content’ will continue to be a valuable component of brands’ social mix, people still trust personal recommendations (i.e. conversations about brands) more than any other source of discovery, so marketers must now focus their efforts on finding ways to inspire social conversations in these more private channels.
Mobile use
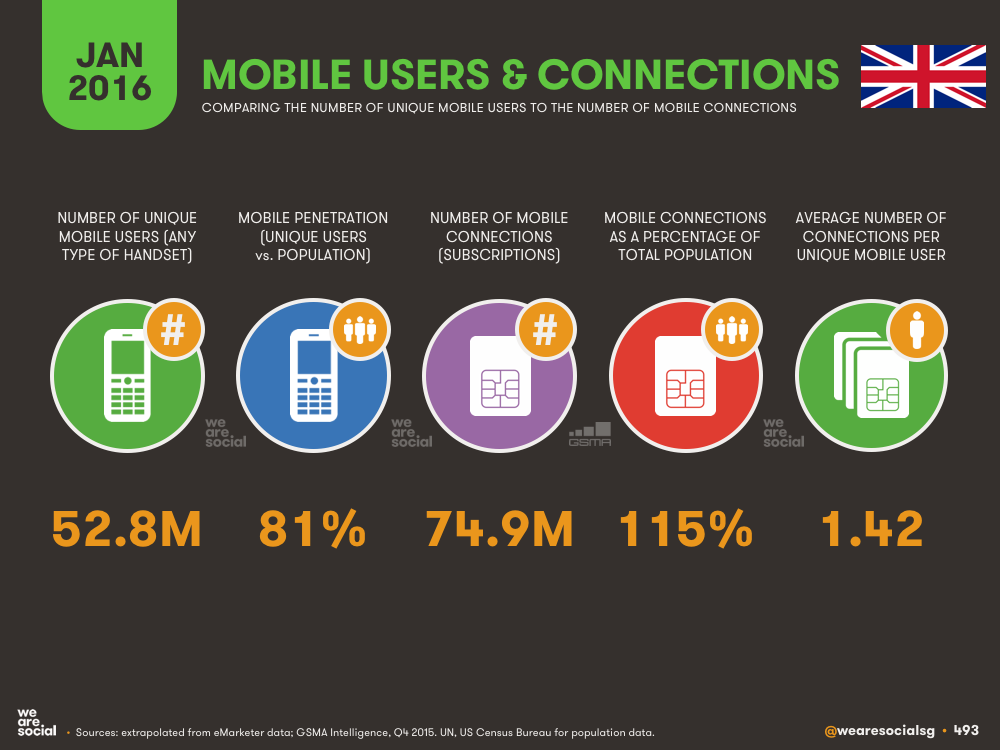
We’re delighted to be able to report data for unique mobile users for the Key 30 economies this year, in addition to the mobile connections data we’ve reported in previous years. Spain (87%), Singapore (85%) and Japan (84%) top the unique mobile user rankings amongst our Key 30, but only 8 of the countries in this year’s study register mobile phone penetration below 67%, once again highlighting how quickly mobile phones have become central to most people’s lives.
According to data from GSMA Intelligence, more than half the world now has a mobile phone, but the number of active mobile connections is almost double that of unique users. This may be for a variety of reasons including M2M (machine-to-machine) connections, and not just down to people maintaining more than one active mobile subscription.
Countries in Eastern Europe record the highest ratio of mobile connections to national population (139%), with only South Asia (77%), Africa (82%) and Central America (88%) registering ratios below 100%.

Mobile Subscriptions vs Total Population by Global Region January 2016 DataReportal
On a local basis, Macau tops the list with a staggering 313% ratio of connections to total population. At the other end of the scale, the number of mobile connections in Micronesia equates to barely 4% of the country’s population.
Phones aren’t just about voice connectivity though. Mobile devices are now the most important device for many people around the world, allowing us access to a wealth of information and entertainment, wherever and whenever we want it. As a result, mobile’s share of internet traffic continues to grow steadily around the world.
This increased share has resulted in an acceleration of our mobile data consumption too, with Ericsson reporting that the average smartphone user now uses roughly 1.4Gb of data every month. Added together, the world’s mobile connections now generate more than 4.5 exabytes of data every month – that’s 4.5 billion gigabytes of data, or more than 1,700 gigabytes every second.
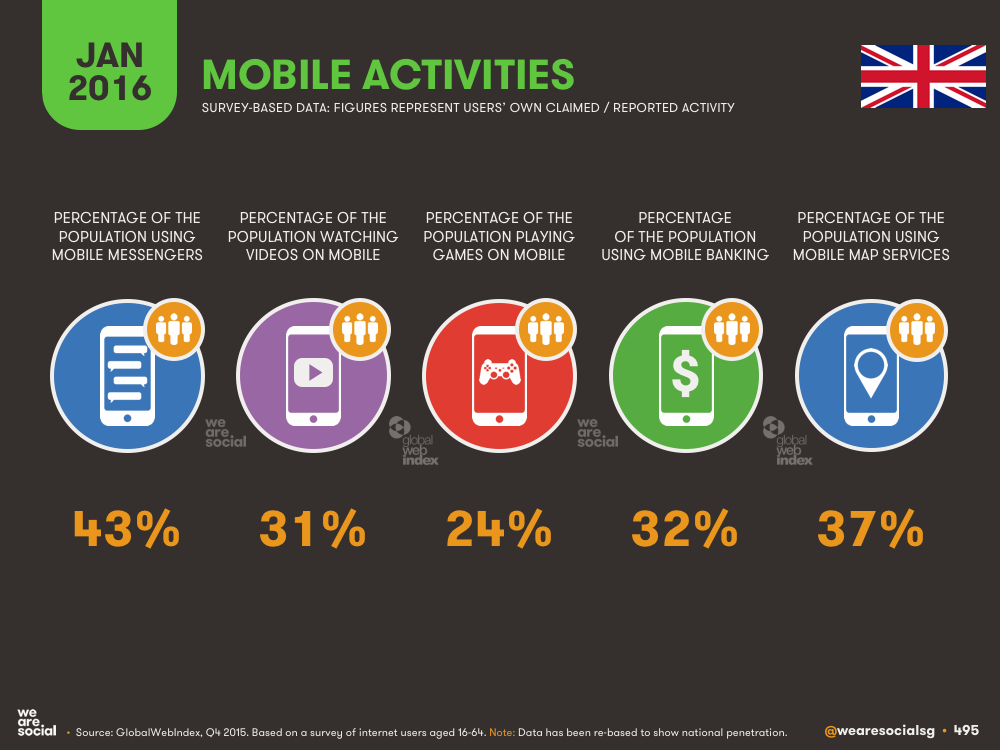
We’re doing more on our phones too; as you’ll see in the individual country sections in the full report, more and more people are watching videos on their phones, chatting to friends via messenger apps, and even managing their finances using mobile banking services.
Perhaps the most important data point for marketers, however, is the usage of M-commerce, which has surged more than 50% in our Key 30 economies in the past twelve months.
Amongst our these countries, South Korea tops the list, with GlobalWebIndex reporting that 43% of the country’s residents bought something online via their mobile phone in the past month.
M-commerce is also huge in China: on Singles Day in November 2015, e-commerce giant Taobao reported that a staggering 69% of its total US$14.3bn transactions on the day – almost US$10Bn – came from mobile devices. To put that in perspective, that’s more than double the value of online sales in the USA on Black Friday, both in terms of absolute dollar value, as well as mobile’s share of the total spend.
Much of this increase in usage is likely being fuelled by improved access to mobile broadband connections, which have also surged in the past twelve months. If we compare broadband connections to total national population, Macau leads the global rankings at 308%, with Kuwait coming in second place. However, the future isn’t evenly distributed when it comes to fast mobile access; Central African Republic, Guinea, Niger and Tonga all register ratios of just 1%, and none of the bottom ten countries exceeds 5%.
However, the good news is that the global average for mobile broadband connectivity has doubled in the past year, from 23% this time last year, to 46% this year.
Individual country data
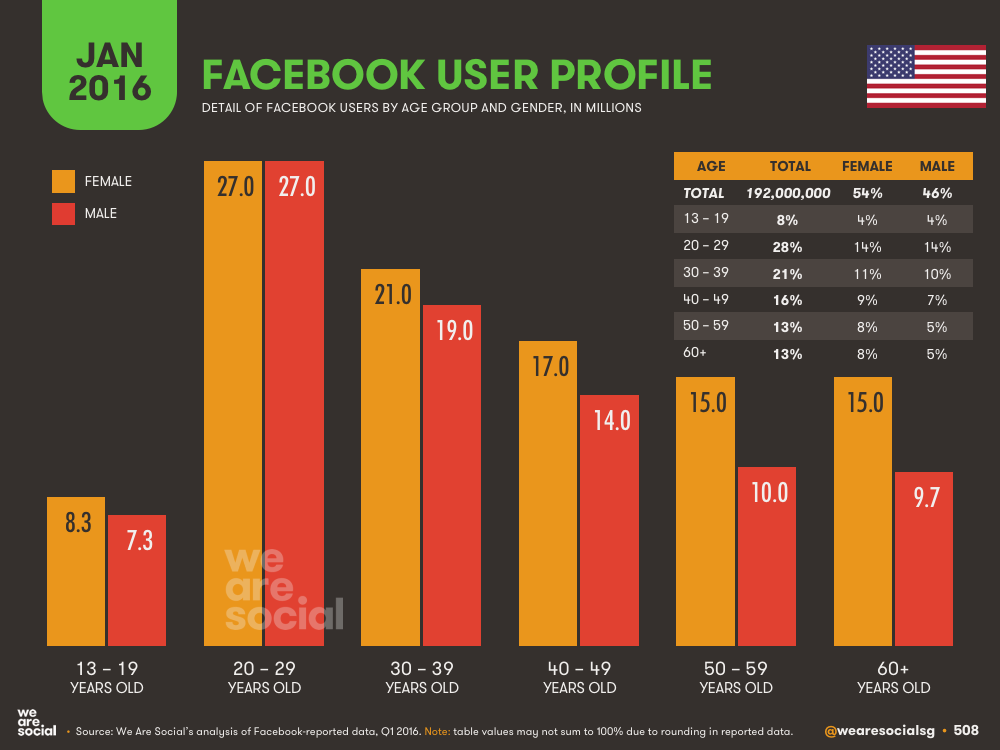
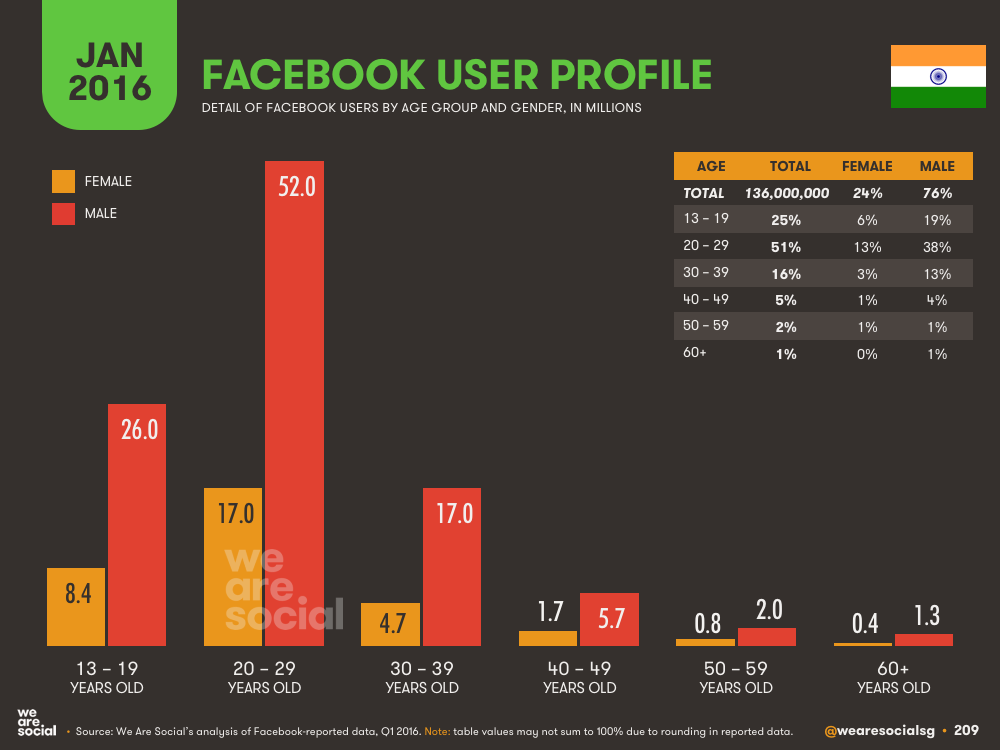
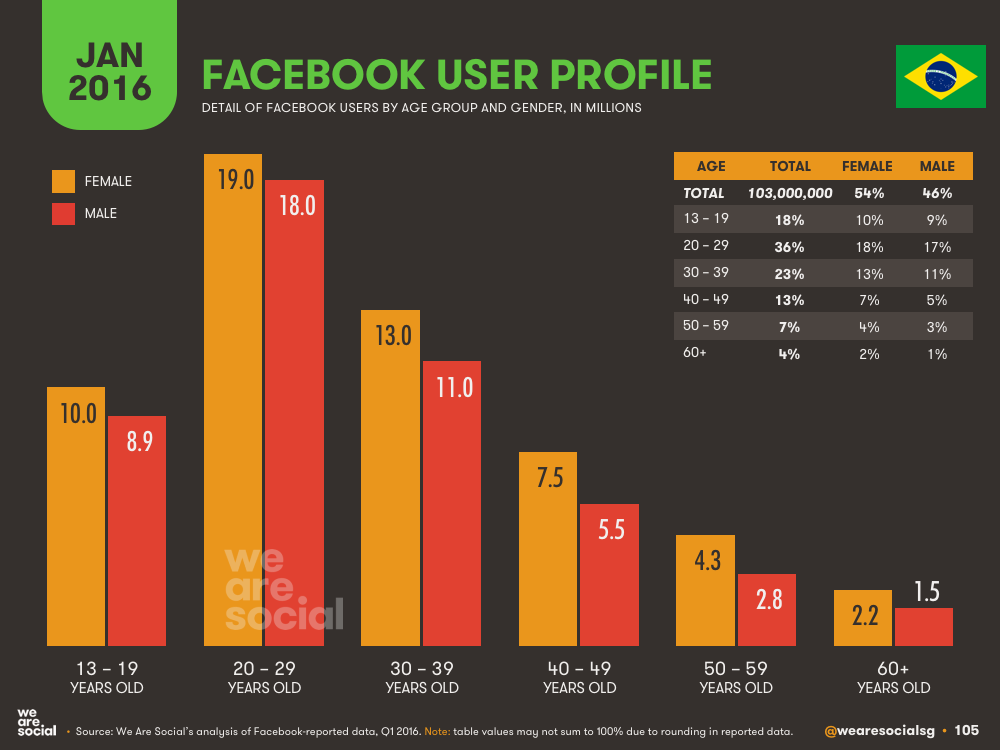
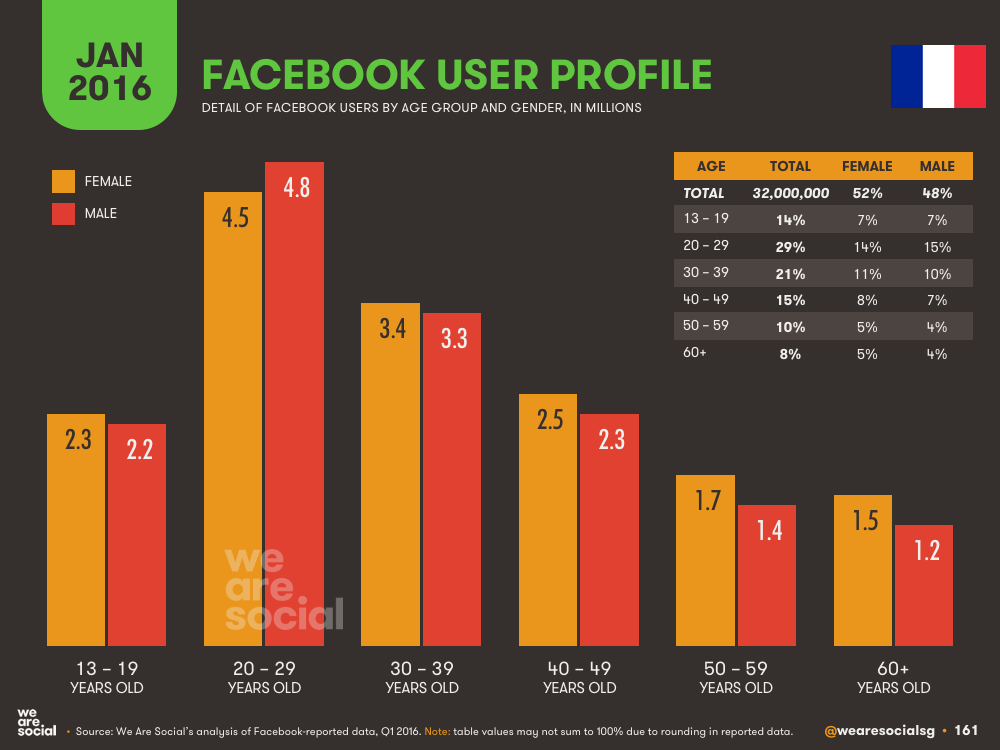
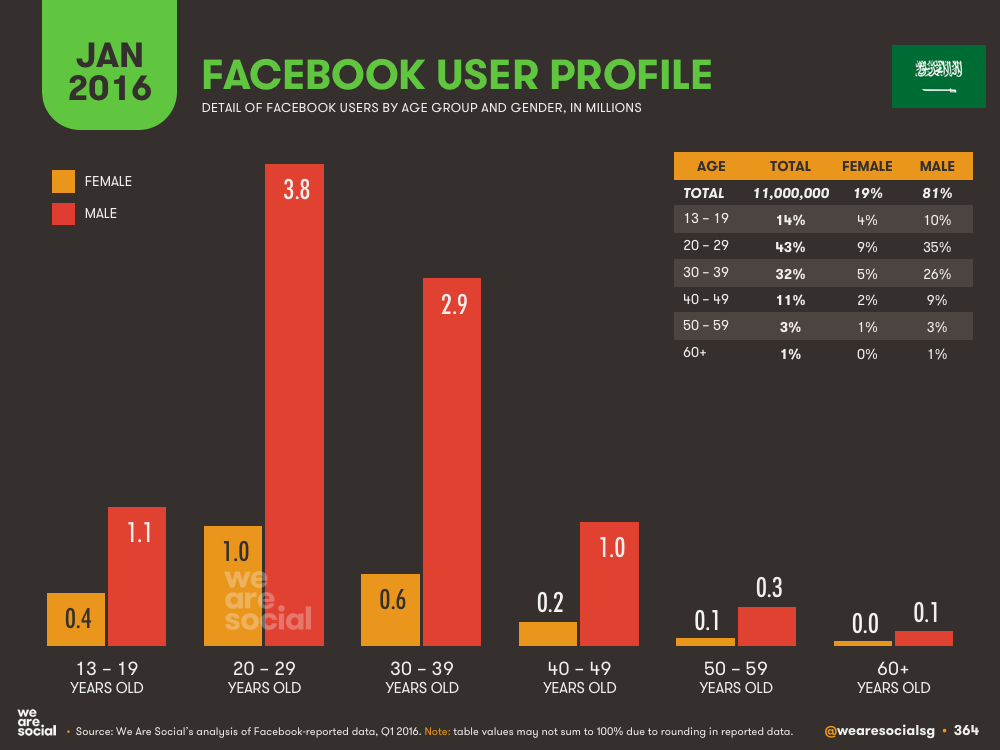
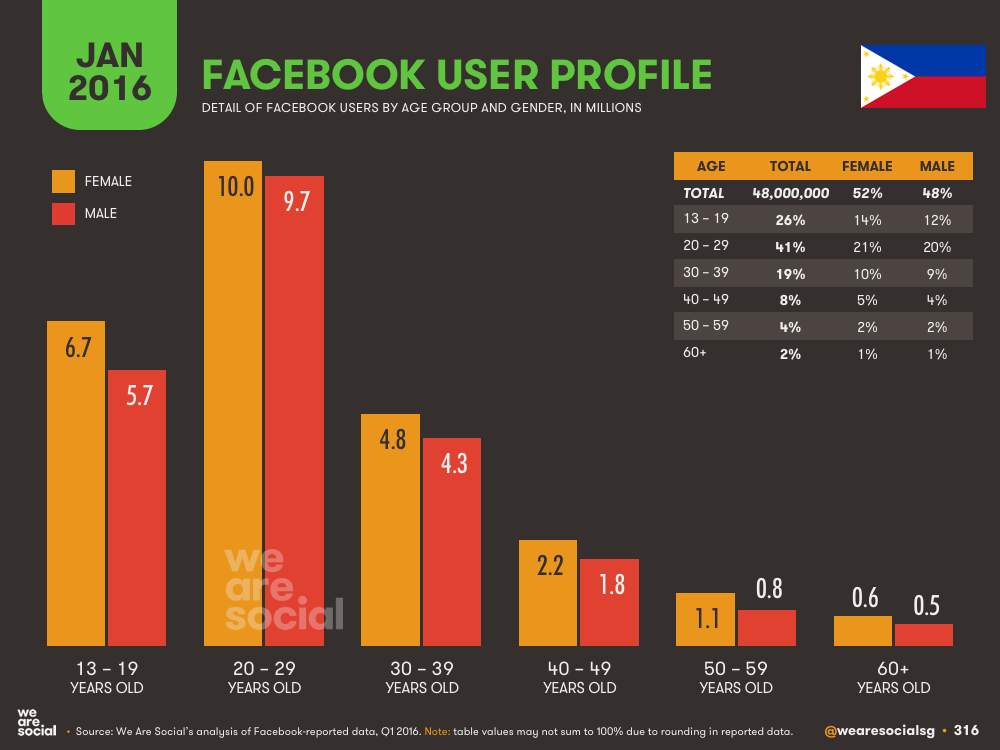
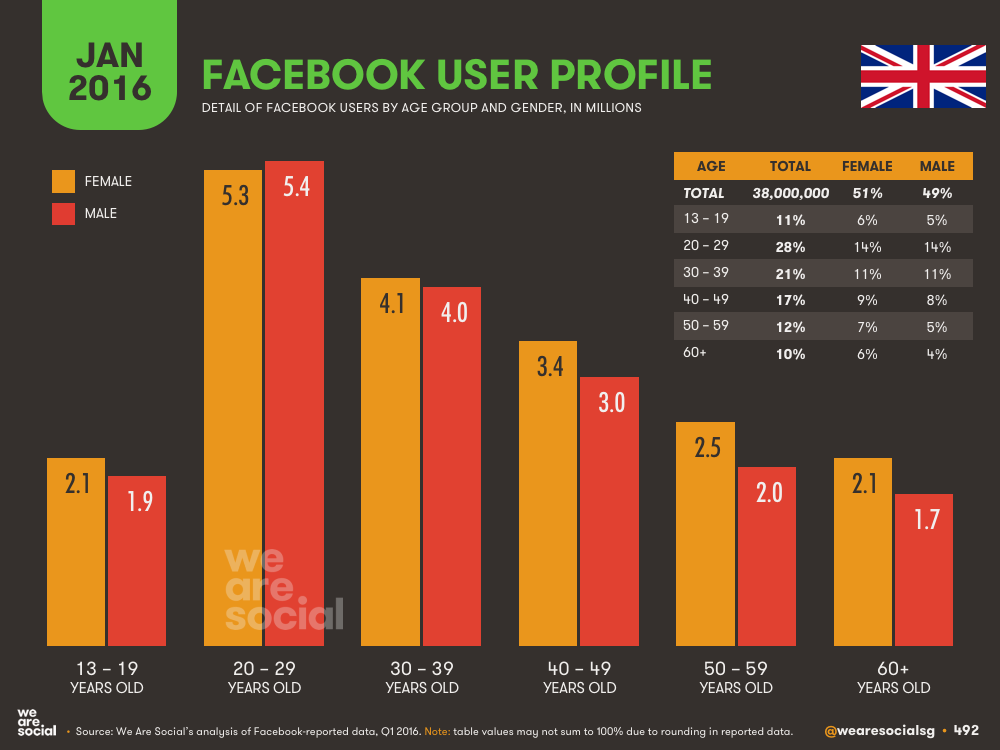
In addition to the figures we shared last year, we’ve added a number of new data points and comparisons to this year’s analysis of the Key 30 economies. One of the highlights for us is the breakdown of national Facebook audiences by gender and age group, which we’re sharing for every country except China, where the user base is too small to be representative. Here are the charts from a small selection of the countries we cover to give you a flavour of what you can expect in the full report:
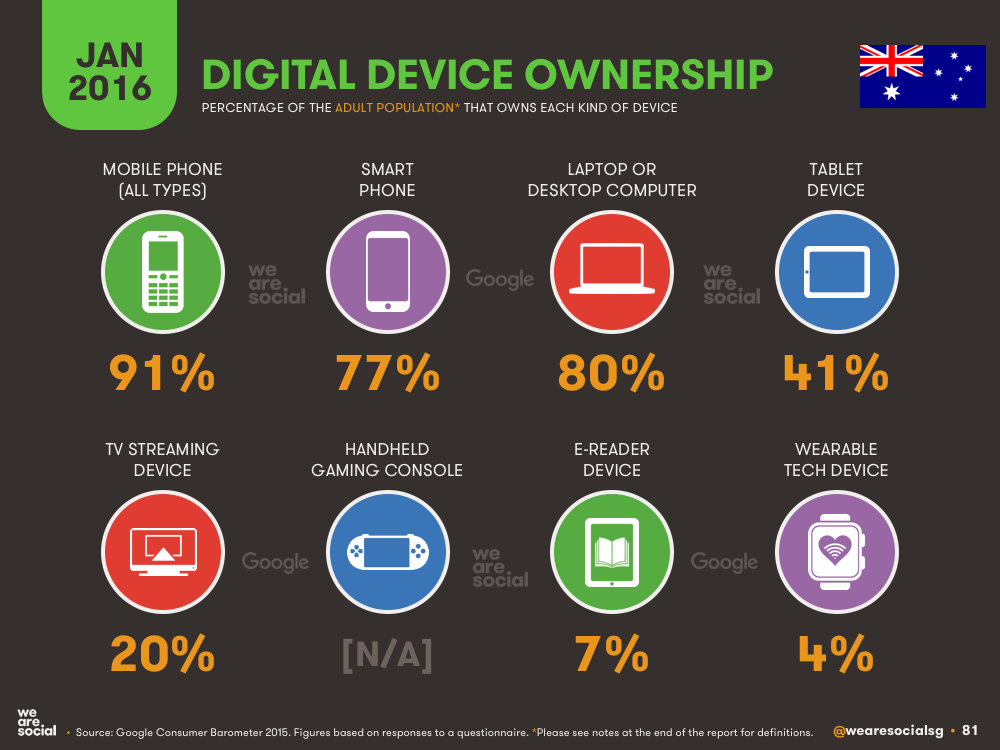
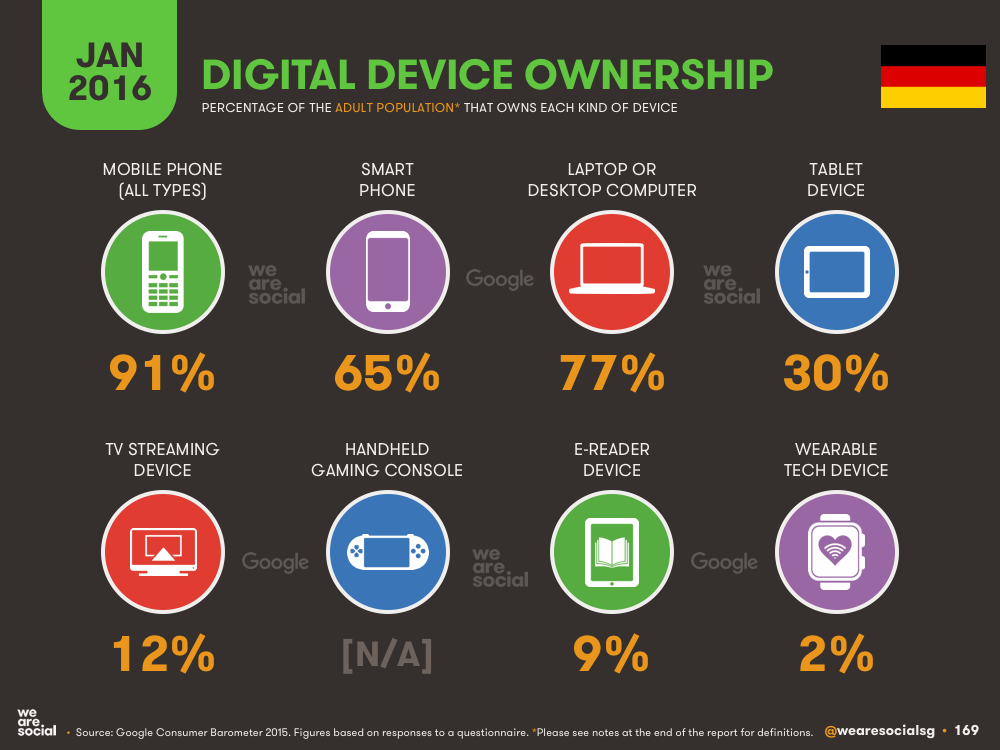
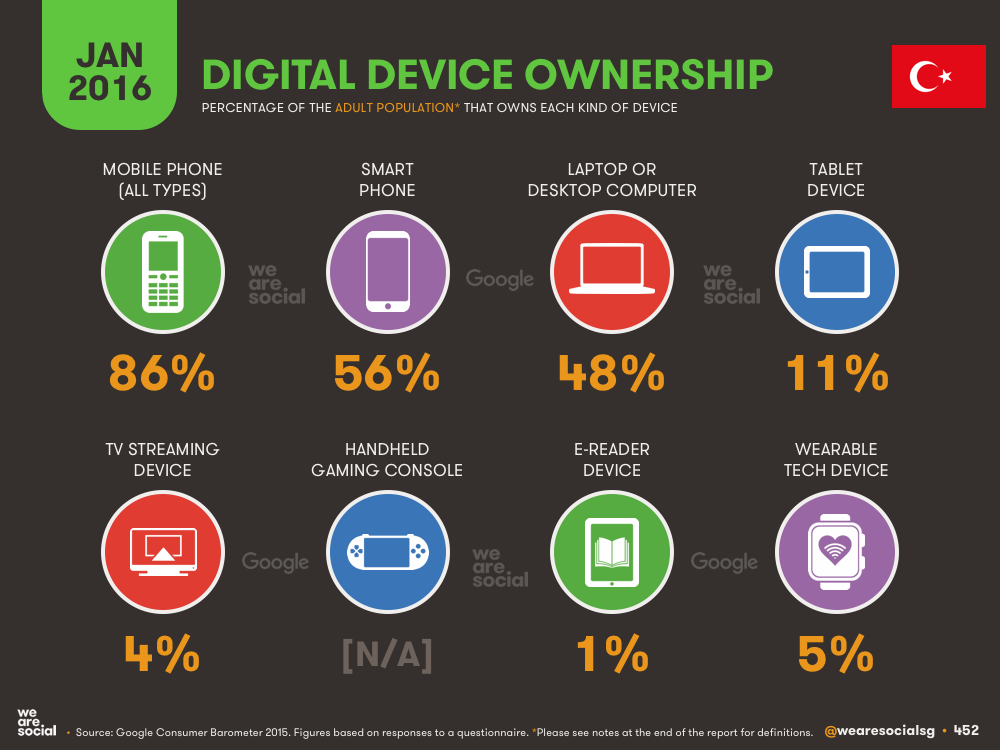
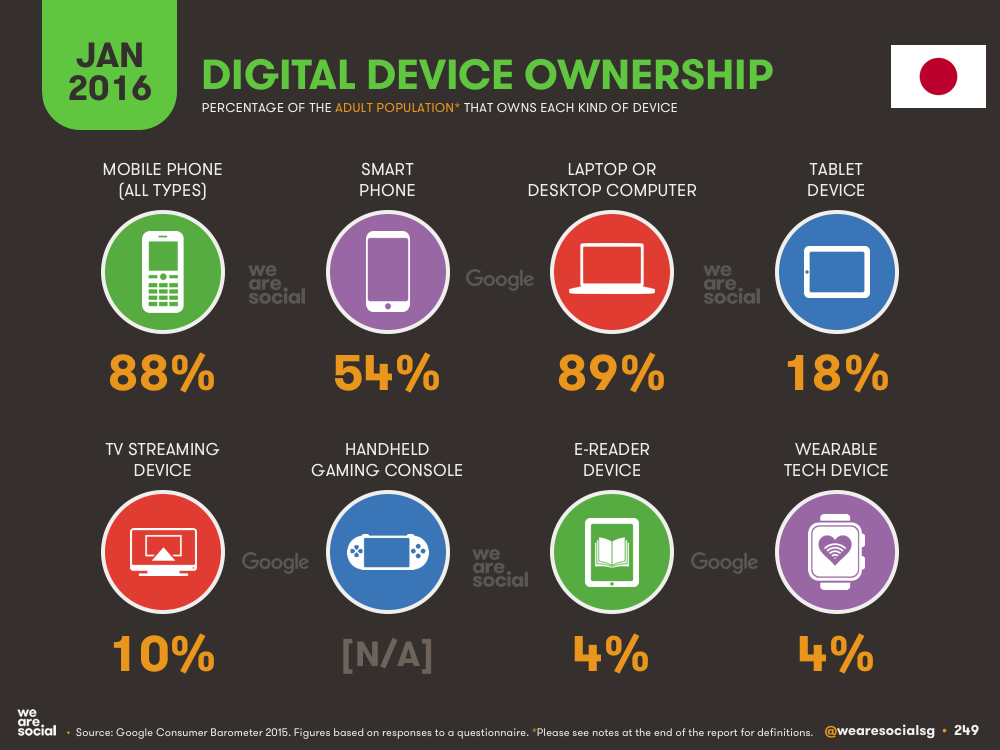
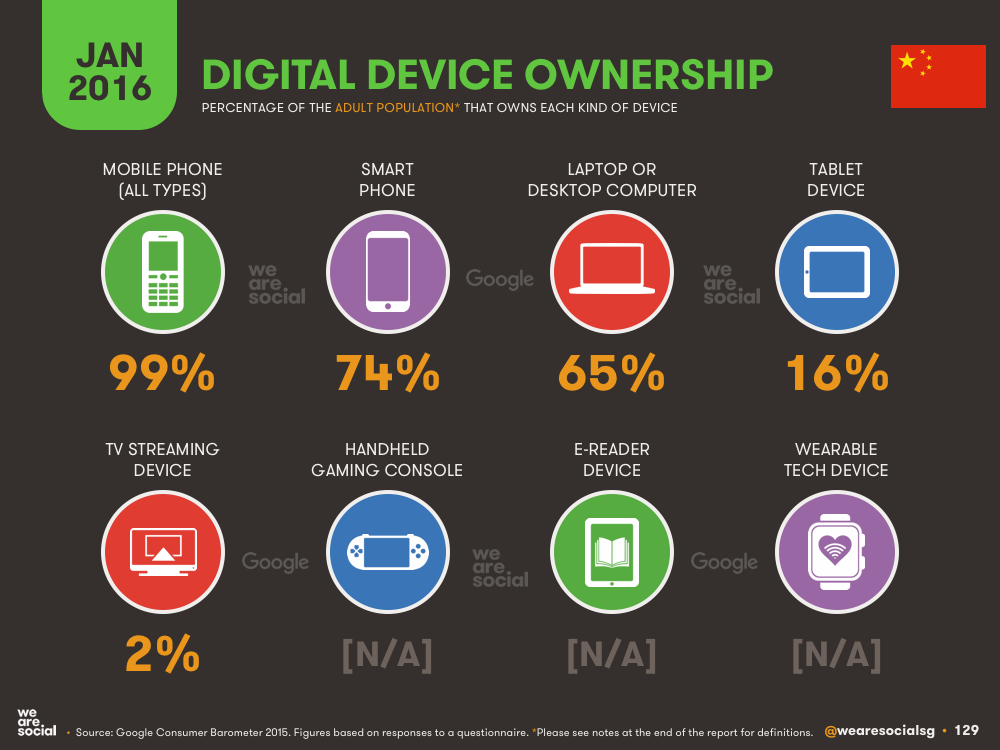
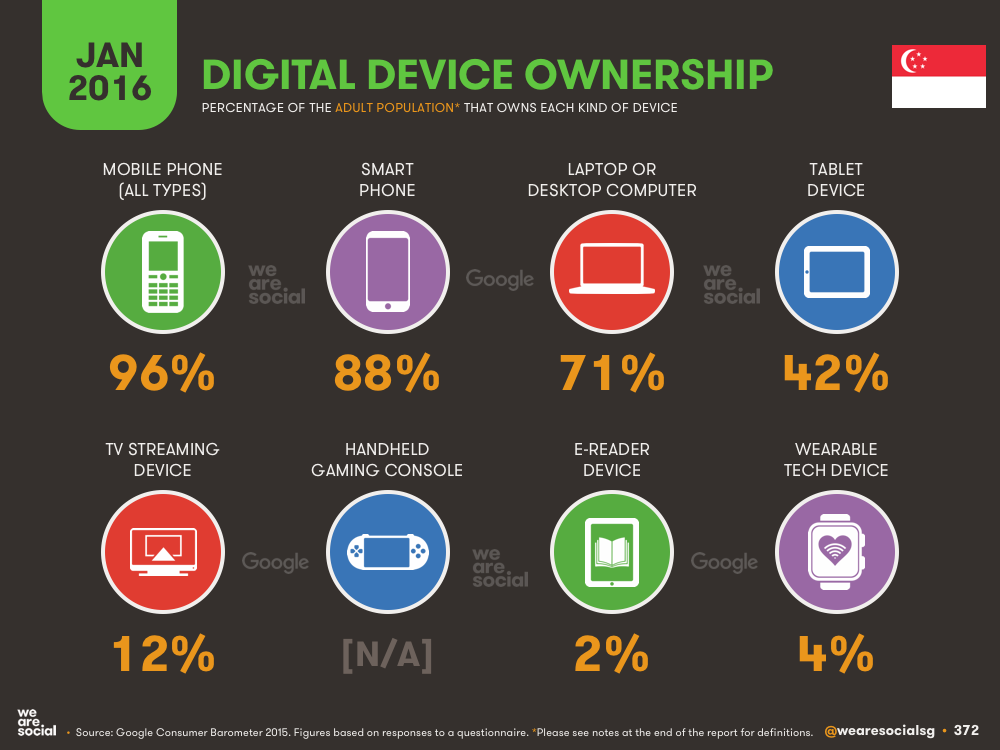
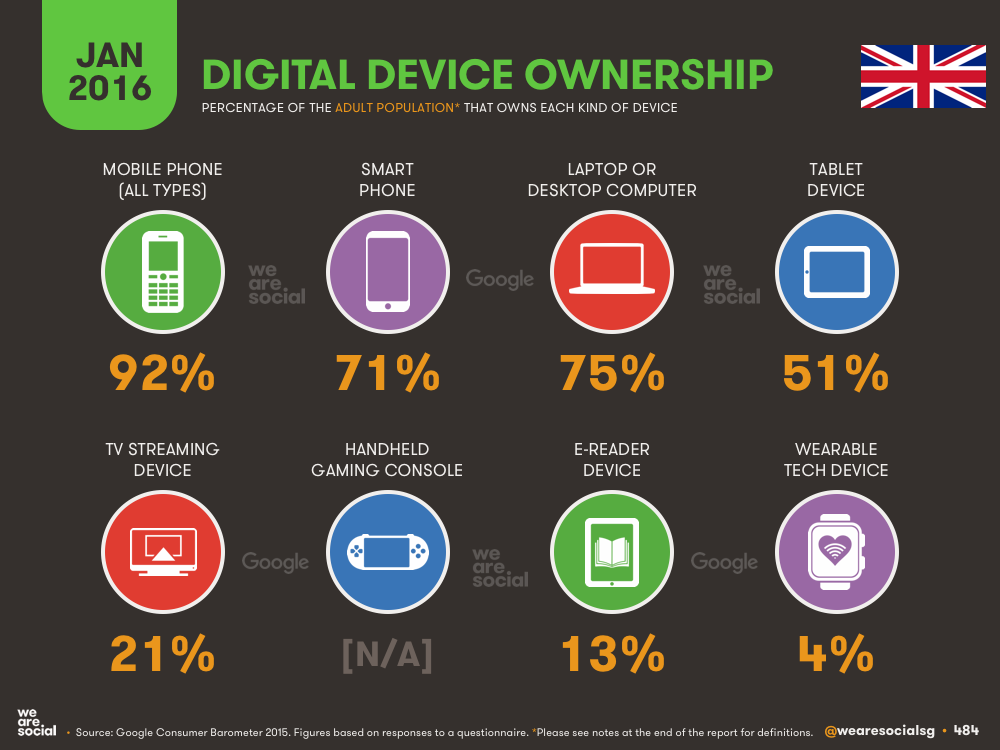
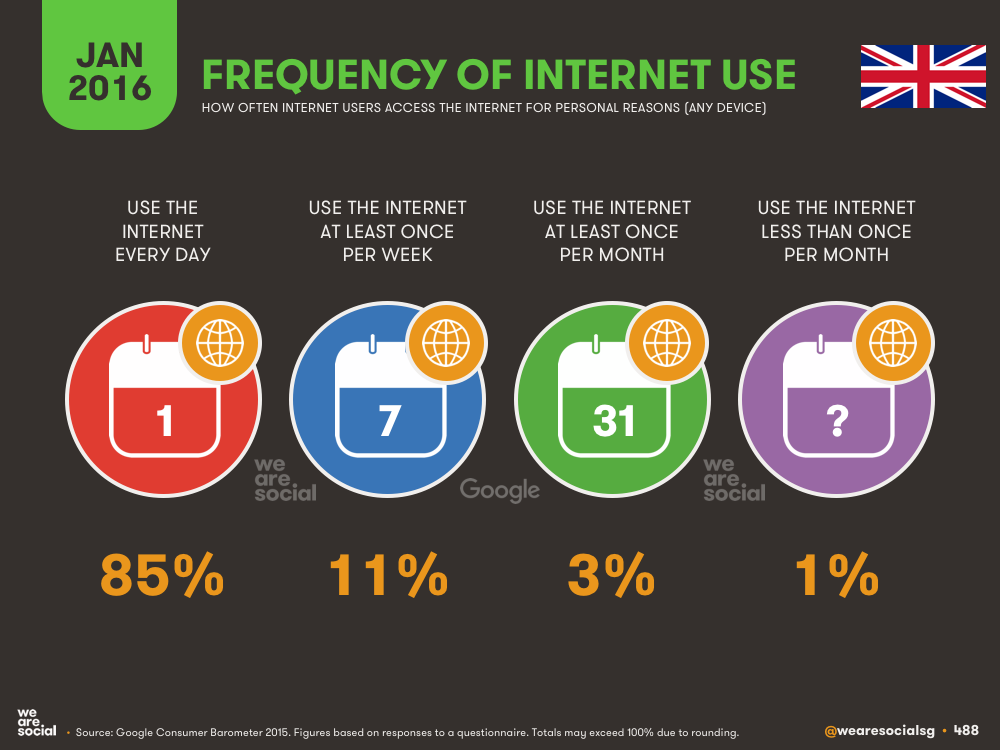
We’ve also included ownership data for a range of digital devices, thanks to a great new Consumer Barometer study from Google and its partners. These new infographics offer insights into the level of usage of a range of important connected tools, including smartphones, computers, and even wearables. Note that the percentages shown on these charts are for adult populations only, and not the total populations that we’ve used for all other data points.
GlobalWebIndex have very kindly allowed us to share their valuable data on social media usage by platform for most of our 30 Key economies too – this is always a valuable chart, and is well worth spending a bit of time interrogating (there were plenty of surprises in there even for us!)
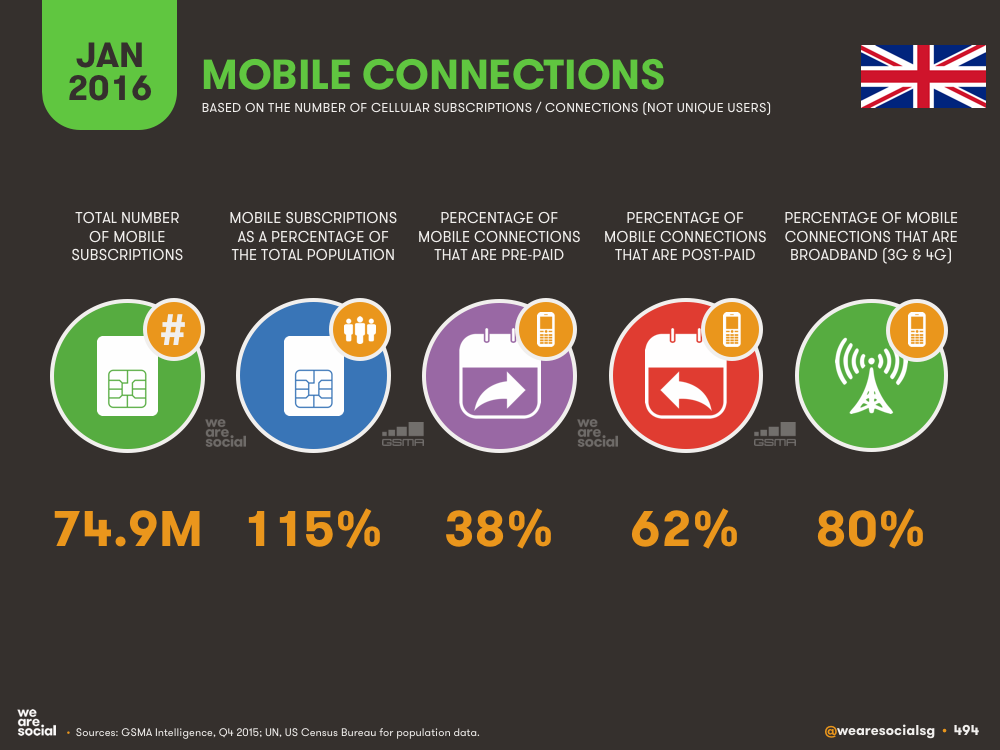
You’ll find 15 individual infographics for most of the Key 30 economies, although we didn’t manage to collect the full set of data for Egypt or Nigeria. As a taster, here’s a gallery of all the slides in the UK country section:
What’s more, as we noted in the introduction to this Executive Summary, we’re also delighted to be able to offer headline data for 232 countries around the world this year – you’ll find them all in the 2016 Digital Yearbook report, which you can read in the embed below.
Conclusions and forecasts
So, what does this huge wealth of data tell us? We’ve got three key take-aways, together with a few related forecasts:
Mobile is dramatically changing everything
Mobile phones aren't just a more convenient way to access the internet; they’re changing people’s fundamental connected behaviour, whether it’s shifting our social media habits to a more one-to-one, private conversation context, to accessing M-commerce whilst we’re at physical world stores, to paying for things directly in those physical stores and on public transport using mobile wallet.So, if you’re still wondering about how to optimise your website for mobile, you’re being left far behind; success tomorrow won’t just be about a mobile web presence, but about optimising your entire organisation for a mobile-centric world.
Connectivity is becoming the norm
More than half of the world’s adult population now uses the internet, and well over one-third of the adult population uses social media at least once a month. Our study of the Key 30 economies – which account for 70% of the world’s population – shows that nearly three-quarters of internet users access the net every single day, and this is still increasing at an impressive rate.People now expect everything to be connected, from their real-time public transport schedule, to the voting system, to real-time stock availability in physical world stores. The internet is no longer just an information portal; it’s the ‘electricity’ of modern society and commerce connecting us to the people and things we care about most. As a result, businesses and brands need to explore how connectivity can improve every element of their business, not just their advertising.
For most people, social is (once again) about conversations
For a few years – namely 2007 to 2014 – social media was largely about sharing our lives publicly with the world. That behaviour still exists, but we’re becoming more selective about what we share, and whom we share it with. For everyone except marketers, social media is quickly returning to what ‘social’ has always been for human beings: connecting on a personal basis with the people we care about most. Many of those people will be people that work for organisations we care about too though, so social’s role in marketing definitely isn’t going away.Indeed, social’s role can now evolve into more value-added experiences, providing the one-to-one meaning that social has always promised, but that marketers have shunned in favour of more flashy, advertising-led ‘public social’ activities. For organisations and brands to succeed in this more personal environment, marketers will need to get better at listening to people and understanding what they want, and not simply using social media as a way to say what we want to say in new ways. The clue is in the name: it’s called social media, not ego media. Let’s make 2016 the year we become truly social brands, and not just brands that interrupt people where they’re socialising with each other.
So there you have it: all the highlights of the digital world in 2016. Here’s to another great year of growth and success!
We’d like to thank a number of people and organisations who helped make this year’s reports possible:
Jason Mander and the entire GlobalWebIndex team for their incredible generosity in providing so much of their valuable data and support;
Matt Ablott and the GSMA Intelligence team for providing us with mobile connections data for almost every country on the planet;
ITU and InternetWorldStats for collating and publishing internet user data for almost every one of the world’s nations;
Facebook for making their active user data available for all except 5 of the world’s countries (we’d be so pleased if we could get the data for Cuba, Iran, Syria, Sudan, and Western Sahara next year!)
Google Consumer Barometer for publishing such a comprehensive and in-depth study of the world’s connected populations;
The StatCounter team for making their web traffic data available to the world;
The Ericsson Mobility team for their hugely valuable, quarterly Mobility Reports;
Akamai for publishing their State of the Internet Report each quarter
eMarketer for collecting and publishing a wide variety of data on internet, social and mobile usage;
All of the government agencies and national industry bodies who publish information about their nation’s connected behaviours.
Note 1: For those who are curious, the discrepancy between internet and social media user figures usually arises because of the difficulties in measuring unique internet users in real-time; in developing nations, many people still access the internet from shared devices, making it particularly difficult to know exactly how many people use the internet. However, commercial opportunities and the need to set up individual accounts make it easier for social media platforms to understand how many people use their services. Social media number also benefit from 'single source’ information, whereas a variety of service providers may be responsible for delivering internet access in an given country, resulting in dispersed or overlapping data.
Note 2: To determine the number of social media users in any given country, we identify the total number of monthly active user accounts on the most active social platform in each country (with the exception of China, where we use QZone, the second most-active platform, due to our concerns over the widespread use of multiple accounts by single individuals on the country's top platform, QQ). Whilst this approach may 'double-count’ people who maintain more than one active account on the top platform, we’re confident that this over-counting will be balanced out by those social media users who do not use the country’s top platform (for example, senior executives may use LinkedIn on a monthly basis, but not use Facebook at all).
Click here to download a free PDF of the complete report (you may need to sign in to SlideShare first).
This article first appeared on the We Are Social blog.