
Digital 2015: Global Digital Overview
2014 was a landmark year for growth across all things digital, and We Are Social's new Digital, Social and Mobile in 2015 report indicates that this year will see even more impressive numbers.
Including stats for more than 230 countries around the world, and profiling 30 of the world's biggest economies in detail, this report is the most comprehensive, free compendium of up-to-date digital statistics and data you'll find.
But what does it reveal?
The headlines
As we've seen in our on-going series of Digital Statshot reports, mobile increasingly dominates the digital world, and we're confident that 'ubiquitous connectivity' will gather even more pace during 2015, as cheaper handsets and more affordable data connections reach further around the world.
What's more, with mobile-oriented services like WhatsApp, WeChat and Facebook Messenger achieving the top social media ranking spots in some of the world's biggest economies, it's clear that much of our digital behaviour is now converging around mobile devices.
Based on the trends within this data, we expect that mobile will help to push internet penetration beyond 50% of the world's population during mid to late 2016.
Before that, though, we expect to see social media penetration reach one-third of the world's population - likely by the end of 2015 - with new users in developing nations accounting for almost all of this growth.
In context: 12 months of amazing growth
The digital world passed some impressive milestones in 2014:
Worldwide social media users exceeded 2 billion back in August;
Worldwide penetration of mobile phones passed 50% in September;
The number of global internet users passed 3 billion in early November;
The number of active mobile connections surpassed the total world population just last month;
Excitingly, the numbers in our new 2015 report suggest that this growth shows no signs of slowing anytime soon:
You'll find an amazing wealth of data and infographics designed for easy copy-paste into your own presentations in the SlideShare embed above, but read on for our additional insights into the numbers.
Internet
Almost 42% of the world’s population has access to the internet in January 2015, representing a significant jump in reported numbers since last year’s report, when the same figure was just 35%:
Our analysis of these numbers suggests that much of this increase is due to more accurate and timely reporting of data rather than a sudden surge in access, but there is little doubt that many millions of new users accessed the internet for the first time in the past 12 months - many of them via mobile phones.
As we reported in early November, more than 3 billion people around the world now use the internet via a variety of different devices. However, access is not evenly distributed: the reported number of internet users in Bermuda, Bahrain and Iceland almost equals those countries’ total reported populations, but the data also suggest that fewer than 0.1% of the populations of North Korea and South Sudan have access to the internet.
Internet connection speeds vary significantly around the world too, from an average of more than 25 Mbps in South Korea, to barely 2 Mbps in India. Hong Kong, Japan, Singapore and the USA make up the top 5 fastest nations after South Korea, with each registering speeds in excess of 10 Mbps, putting them well above the global average of 4.5 Mbps:
The average internet user spends around 4 hours and 25 minutes using the net each day, with Southeast Asians registering the highest average daily use. Research conducted by GlobalWebIndex shows that Filipino internet users spend more than 6 hours per day using the net, with Thais, Vietnamese, Indonesians and Malaysians also all averaging more than 5 hours of use per day:
Mobile internet
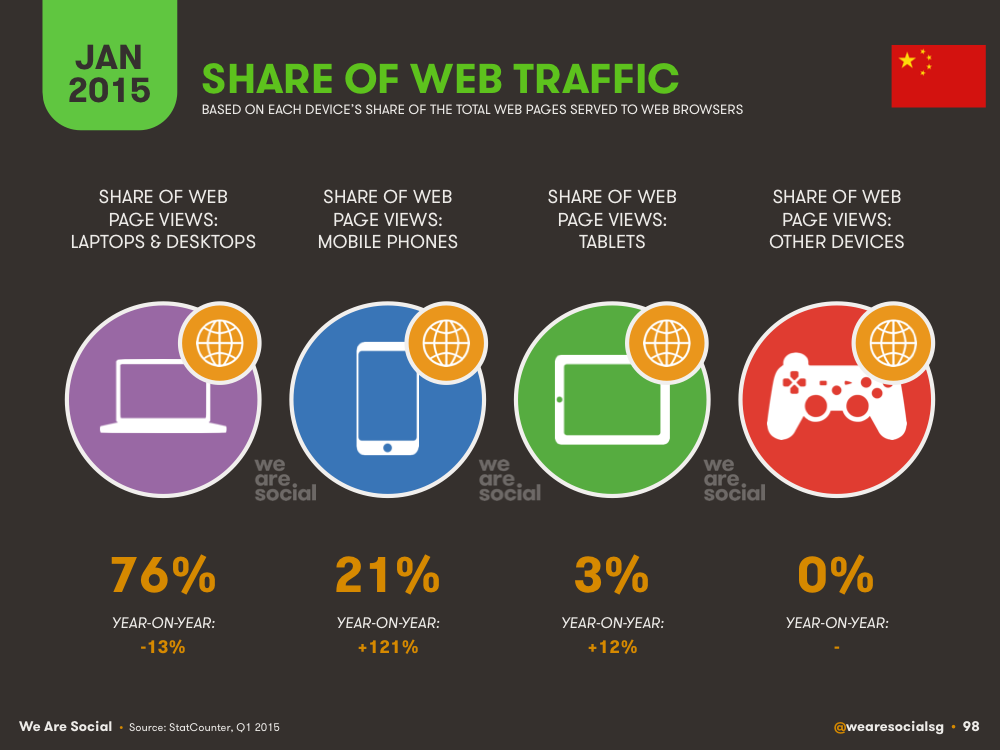
Mobile’s share of global web traffic leapt 39% since the same time last year, with one-third of all web pages now served to mobile phones:
However, mobile’s share of the web also varies considerably around the world: mobile phones account for 89% of all pages served in Papua New Guinea, but barely 0.1% of pages served in some of the smaller Caribbean islands.
It's worth highlighting that India's web traffic is dominated by mobile devices, with phones alone accounting for 72% of all web pages served in the world's second most populous nation:
The good news is that the potential for faster mobile internet access has grown exponentially in the past year, with 39% of all global mobile connections now classified as ‘broadband’ (i.e. 3G or 4G):
Social media
Social media continues to grow apace around the world too, with active user accounts now equating to roughly 29% of the world’s population.
Monthly active user (MAU) figures for the most active social network in each country add up to almost 2.08 billion – a 12% increase since January 2014:
Meanwhile, research conducted by GlobalWebIndex suggests that the average social media user spends 2 hours and 25 minutes per day using social networks and microblogs, with Argentinian and Filipino users registering the most, at more than 4 hours per day:
Facebook continues to dominate the global social media landscape, claiming 1.366 billion active users in January 2015. Crucially, 1.133 billion of the platform’s global users – 83% of the total – now access the service through mobile devices.
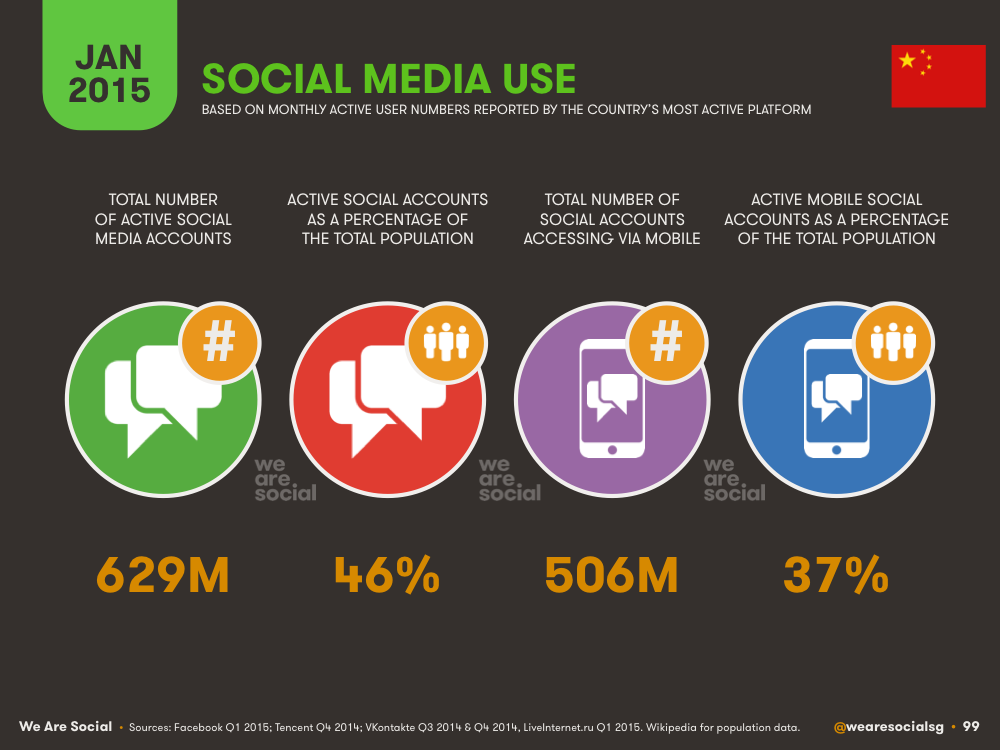
Meanwhile, Tencent extended its dominance of Chinese-language social networks, with Qzone’s 629 million active accounts leading the pack. However, our analysis indicates that a number of the platform’s users have more than one account, meaning this figure may not be reliable as a basis for the calculation of social media penetration.
VKontakte retains the top social media spot in Russia and a handful of its neighbours, although reliable monthly active user figures are more difficult to come by. The latest data suggest the platform has around 100 million monthly active users, of which roughly two-thirds are in Russia.
Mobile social
As we saw above, mobile usage of social networks like Facebook continues to grow all over the world. Adding up the mobile users of the top social network in each country, we see at least 1.65 billion active mobile social accounts in January 2015:
Meanwhile, instant messenger services and chat apps continue their impressive growth patterns, with WhatsApp, WeChat, Facebook Messenger and Viber all reporting more than 100 million new monthly active users over the past 12 months.
Instant messenger services and chat apps now account for 3 of the top 5 global social platforms, and 8 instant messenger brands now claim more than 100 million monthly active users:
As in other areas of this year’s report, much of this growth has been fuelled by the increasing importance of mobile devices in people’s everyday lives, and this trend looks set to accelerate in 2015.
Mobile devices
Unique mobile users exceeded 50% of the world’s population in September 2014, and the current year-on-year growth rate of more than 5% suggests we’ll see roughly 200 million new mobile users over the next 12 months.
GSMA Intelligence and Ericsson both report more than 7 billion active mobile subscriptions, but it’s important to note that the average global mobile user still maintains roughly two active connections:
Smartphones account for an increasingly large proportion of mobile use, with Ericsson reporting that these devices claim a 38% share of the world’s active connections:
Almost 4 in 10 global mobile connections now qualify as ‘broadband’ – i.e. a 3G connection or better – but as with so many other aspects of this report, fast mobile data access varies hugely from one country to the next:
Reports suggest that all of North Korea’s 2.8 million mobile connections are 3G or above, although this is tempered by the fact that the internet – or at least the internet as we know it in the rest of the world – is not available to the country’s average citizen. However, at 11% penetration – 65% up on the same period last year – the role of mobile in North Korea may be cause for optimism.
As with fixed internet access, South Korea is streets ahead of the rest of the world when it comes to mobile internet speeds, with the country’s mobile operators delivering an average connection of 18.2 Mbps - twice as much as any other nation.
Singapore and the UK follow, with 9.1 Mbps and 8.1 Mbps respectively. India, Brazil, Argentina all registered average mobile data connections below 2 Mbps, while Vietnam registered the slowest average mobile data connection in this years report, at barely 1.1 Mbps:
Despite these slow speeds, data reported by Ericsson in its latest Mobility Report suggest that the average global mobile connection uses around 900MB of data every month, with total monthly global data traffic rapidly approaching 3 exabytes – i.e. 3 billion gigabytes:
However, more than three-quarters of the world’s mobile connections are still pre-paid, and the costs of acquiring a phone and maintaining an active mobile connection continue to represent a significant proportion of household expenditure in many developing nations.
As a result, content producers and marketers must balance their desire to provide ‘rich’ user experiences such as online video with the likely costs that this will entail for their audiences:
What’s more, 58% of the world’s mobile connections still come from more basic, ‘feature’ phone handsets, meaning many people will be unable to access such content even if they’d like to.
At the other end of the mobile spectrum, the use of tablets increased steadily during 2014, with 7% of all web pages served in the past month going to these devices.
Combined, mobile phones and tablets now account for 38% of all web pages served around the world.
Mirroring this trend, laptops and desktops saw a 13% decline in share of web traffic compared to the same period last year, down to 62% of all web pages served:
Online shopping
Thanks to some great data from GlobalWebIndex, we’re delighted to include some detailed data points relating to online shopping for most of the countries in this year’s report.
The United Kingdom leads in terms of active e-commerce use, with data suggesting that almost two-thirds of the country’s population bought something online in the past month
Germany and South Korea follow close behind at 63% and 62% respectively, while the USA comes in fourth at 56%
South and Southeast Asia lag when it comes to e-commerce though, with data suggesting barely 14% of Indians bought something online in the past month. Similarly, fewer than 1 in 5 Thais and Filipinos used e-commerce in the past 30 days:
Mobile commerce is picking up momentum around the world though though, especially in East Asia, with data suggesting that 37% of South Koreans bought something online via a mobile phone in the past month.
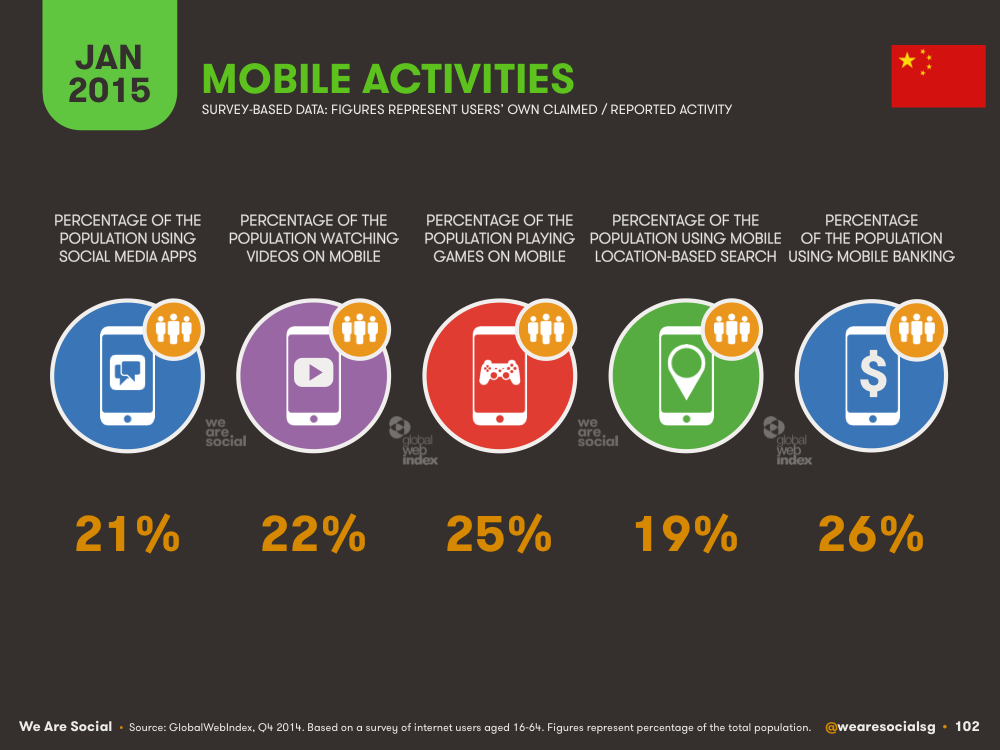
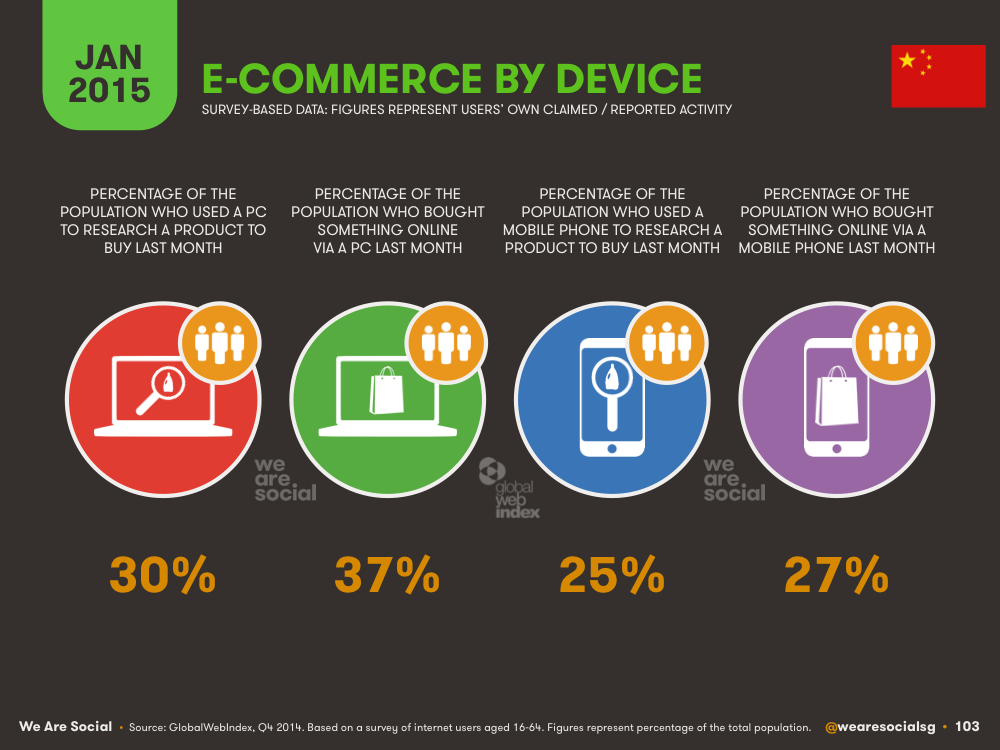
The Chinese are also increasingly active mobile shoppers, with 27% of the population buying something through their phones in the past 30 days:
Local country profiles
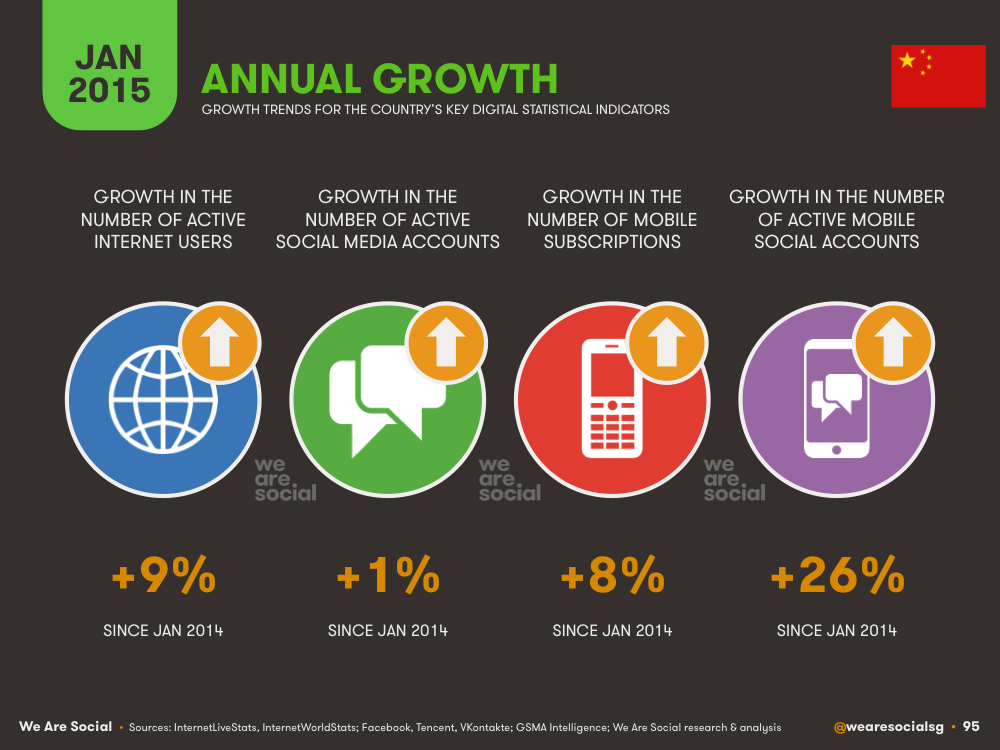
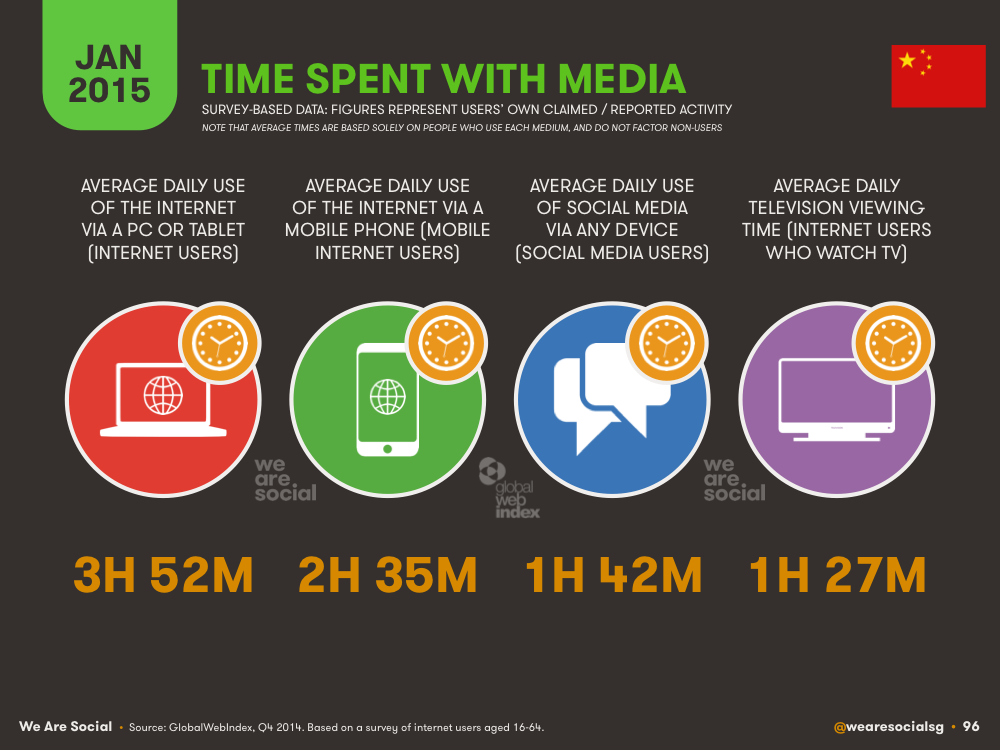
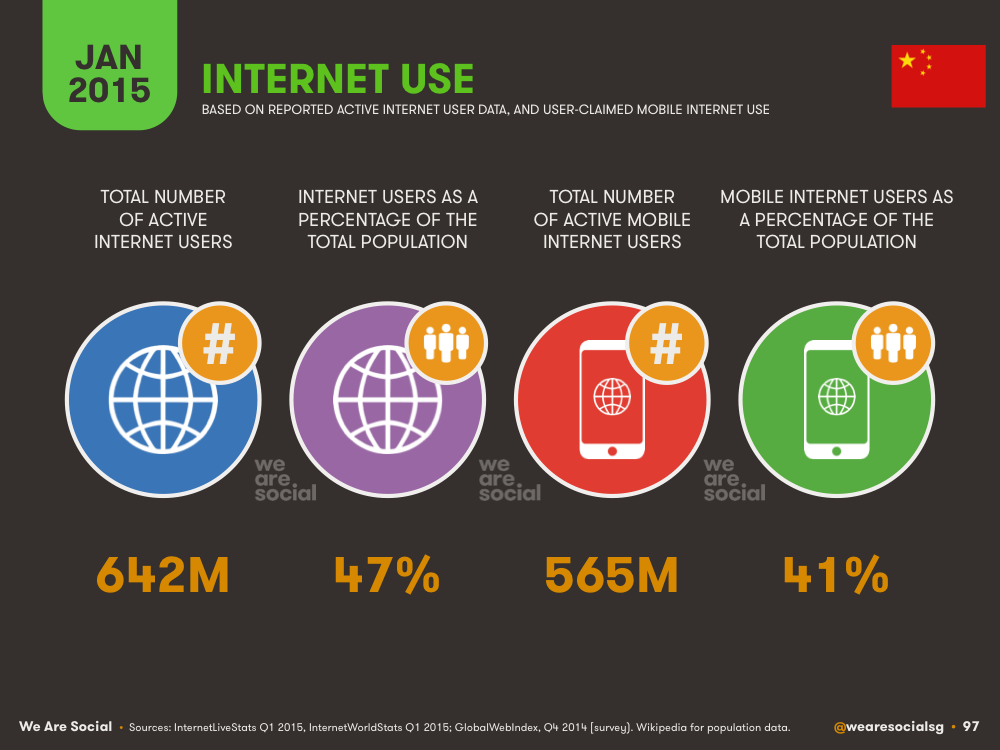
You'll also find in-depth profiles of 30 of the world's largest economies across the individual Digital 2015 country reports, in the same format as the China slides you'll find at the bottom of this post.
Here's a list of the countries we cover in detail:
In addition to checking out all of those local country reports, you may also want to refer back to our reports from previous years; you'll find them all in one convenient library here, but you may find our 2014 report and analysis particularly useful.
We'll leave you with the country slides for China:


Click here to download a free PDF of the complete report (you may need to sign in to SlideShare first).
This article first appeared on the We Are Social blog.