
What’s really going on with Twitter?
The headline at the top of Twitter’s Business site proclaims “People come to Twitter to discover #WhatsHappening”.
But in something of an ironic twist, it’s becoming increasingly difficult to discern what’s happening at Twitter itself.

Since Elon Musk completed his acquisition of Twitter in October 2022, global media have been rife with speculation about the platform’s fortunes and prospects.
Many of these articles have focused on one or two individual metrics, but in so doing, they’ve provided an incomplete picture of Twitter’s current position.
So, in this article, we’ll take a look at a wide variety of different measures and metrics – sourced from a variety of different sources – in an attempt to make better sense of what’s really going on with Twitter.
Note: all metrics quoted in this article represent worldwide Twitter activity. Data for individual countries may show different trends.
Twitter’s “official” user numbers
Let’s start by looking at Twitter’s most recent, “official” user numbers.
Since Musk took the company private in October, Twitter has stopped publishing the investor earnings reports that previously served as the most reliable source of insight into the platform’s performance.
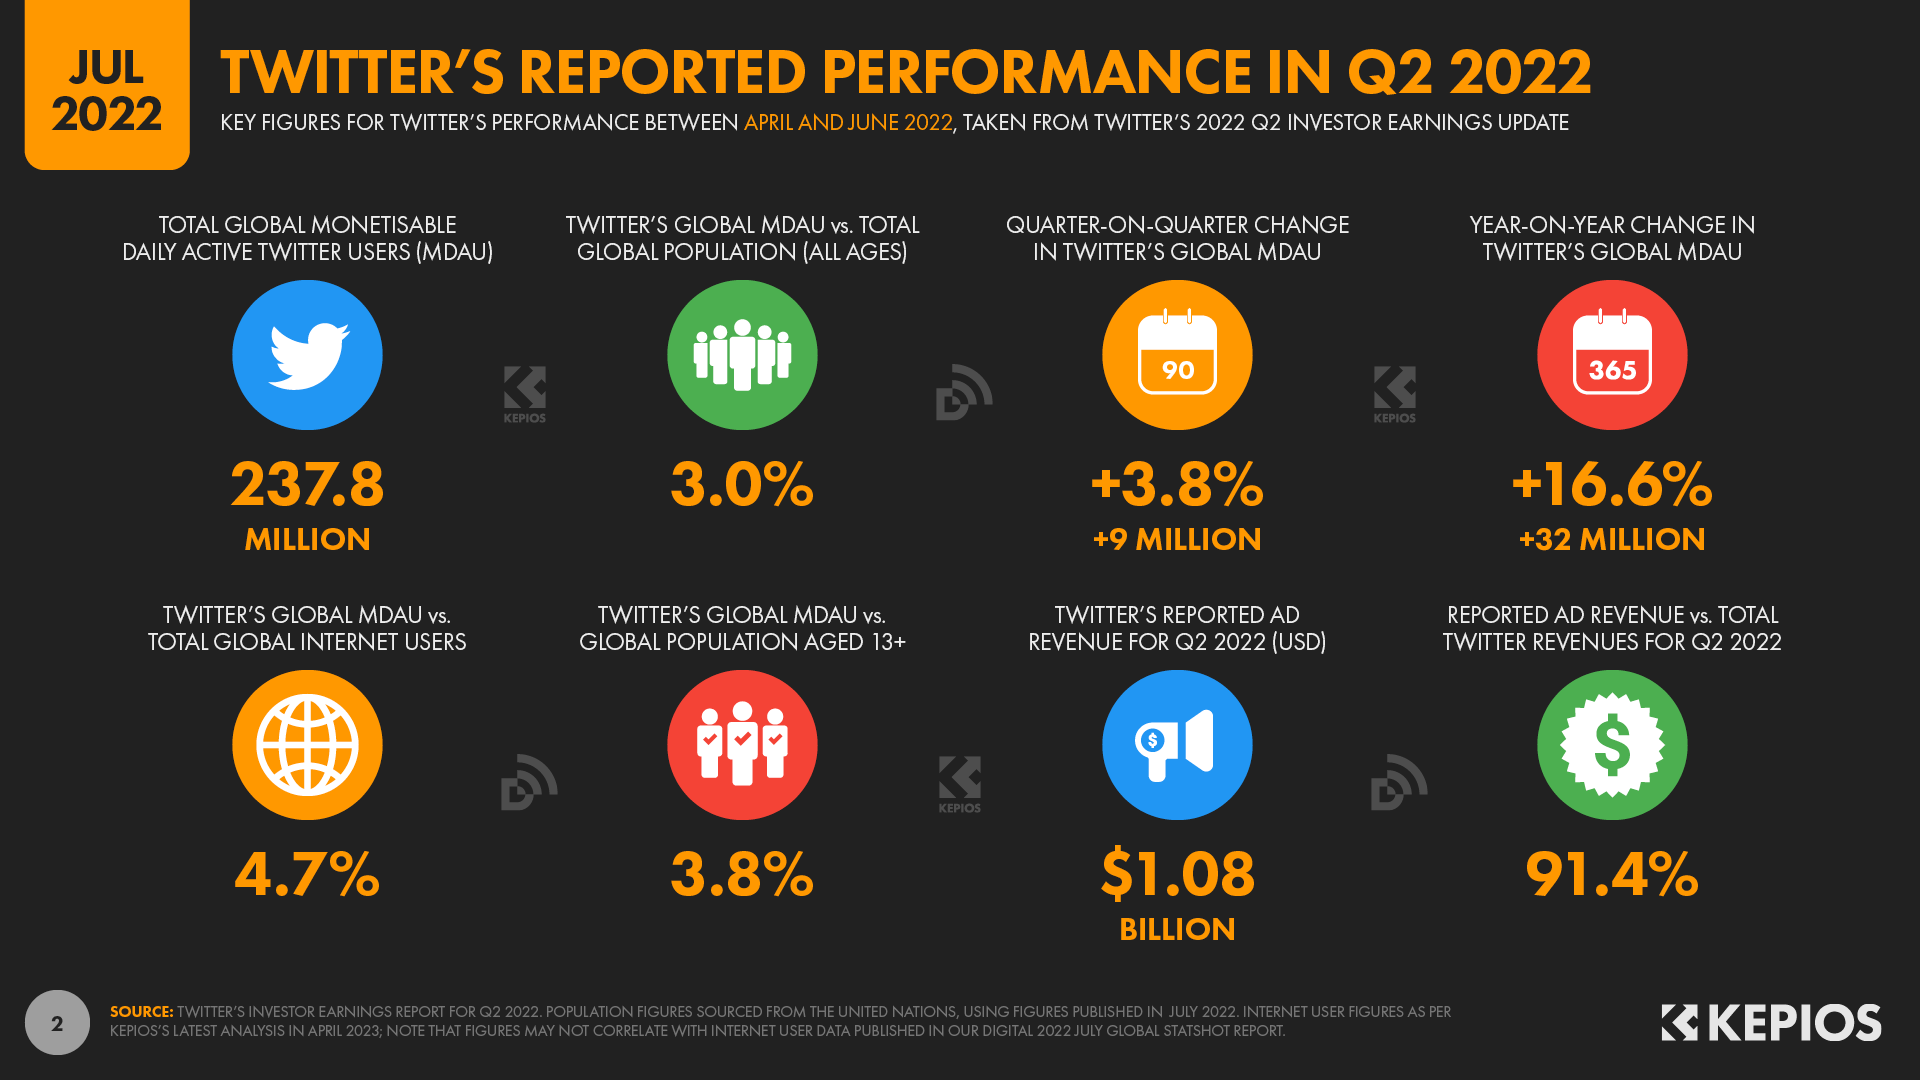
The company’s last investor update – which focused on platform activity between April and June 2022 – revealed that the company had 237.8 million “monetisable daily active users” (mDAUs) by the middle of last year.
At that time, the company reported that the platform’s mDAU base was growing at an annualised rate of 16.6 percent, while the 237.8 million figure was 3.8 percent higher than the 229 million figure that the company had published just 3 months prior, in its Q1 2022 investor update.
For reference, Twitter offered the following definition of its mDAU metric in its Q2 2022 earnings update:
“Twitter defines monetisable daily active usage or users (mDAU) as people, organisations, or other accounts who logged in or were otherwise authenticated and accessed Twitter on any given day through twitter.com, Twitter applications that are able to show ads, or paid Twitter products, including subscriptions.”
In other words, these active user figures include entities other than “human individuals” (e.g. companies), which will have particular importance later in this article.
Growth over time
But data from one quarter alone isn’t a reliable basis on which to build forward-looking projections.
In the three years prior to Musk’s acquisition, figures published in Twitter’s earnings reports show average quarterly mDAU growth of roughly 4½ percent.
However, as we see with other social media platforms like Facebook and Snapchat, active user growth tends to fluctuate from quarter to quarter.
Moreover, that average was distorted by outsized figures during the first half of 2020, when Twitter’s news-centric focus fuelled significant jumps in active user numbers following the outbreak of the COVID-19 pandemic.
However, the global mDAU figure then grew by a much smaller margin in Q3 2022, before returning to a more steady pattern after that.
So, if we focus on that more recent, “stable” period (i.e. from Q4 2020 to Q2 2022), we get an average quarterly growth figure of 3.5 percent.
Projecting the trend
So, in a hypothetical scenario where Twitter’s global user base continued to grow at roughly the same rate after Musk’s acquisition, we might expect Twitter to have somewhere in the region of 255 million daily active users today.
However, Musk himself reported that Twitter’s users had already reached 250 million by November 2022.
There hasn’t been any “official” word on active Twitter use since the start of 2023 though, so we need to look to other data to offer a sense of where Twitter use might be today.
We’ll start by looking at the last remaining source of regularly updated, “official” Twitter numbers: Twitter’s ad reach.
But just before we explore those numbers, it’s important to clarify the relevance – and the importance – of this data in Twitter’s continued survival.
Twitter ads: Musk’s “necessary evil”?
Elon Musk has clearly stated that he’s unhappy with the way advertising affects the Twitter experience:
Ads are too frequent on Twitter and too big. Taking steps to address both in coming weeks.
— Elon Musk (@elonmusk) January 21, 2023
However, it’s very unlikely that Musk would be able to do away with ads on the platform any time soon – even for the platform’s paying subscribers.
For context, Twitter’s last investor earnings announcement in July 2022 revealed that more than 90 percent of the company’s erstwhile revenues came from advertising (note that the values in the table below are in thousands of US dollars):
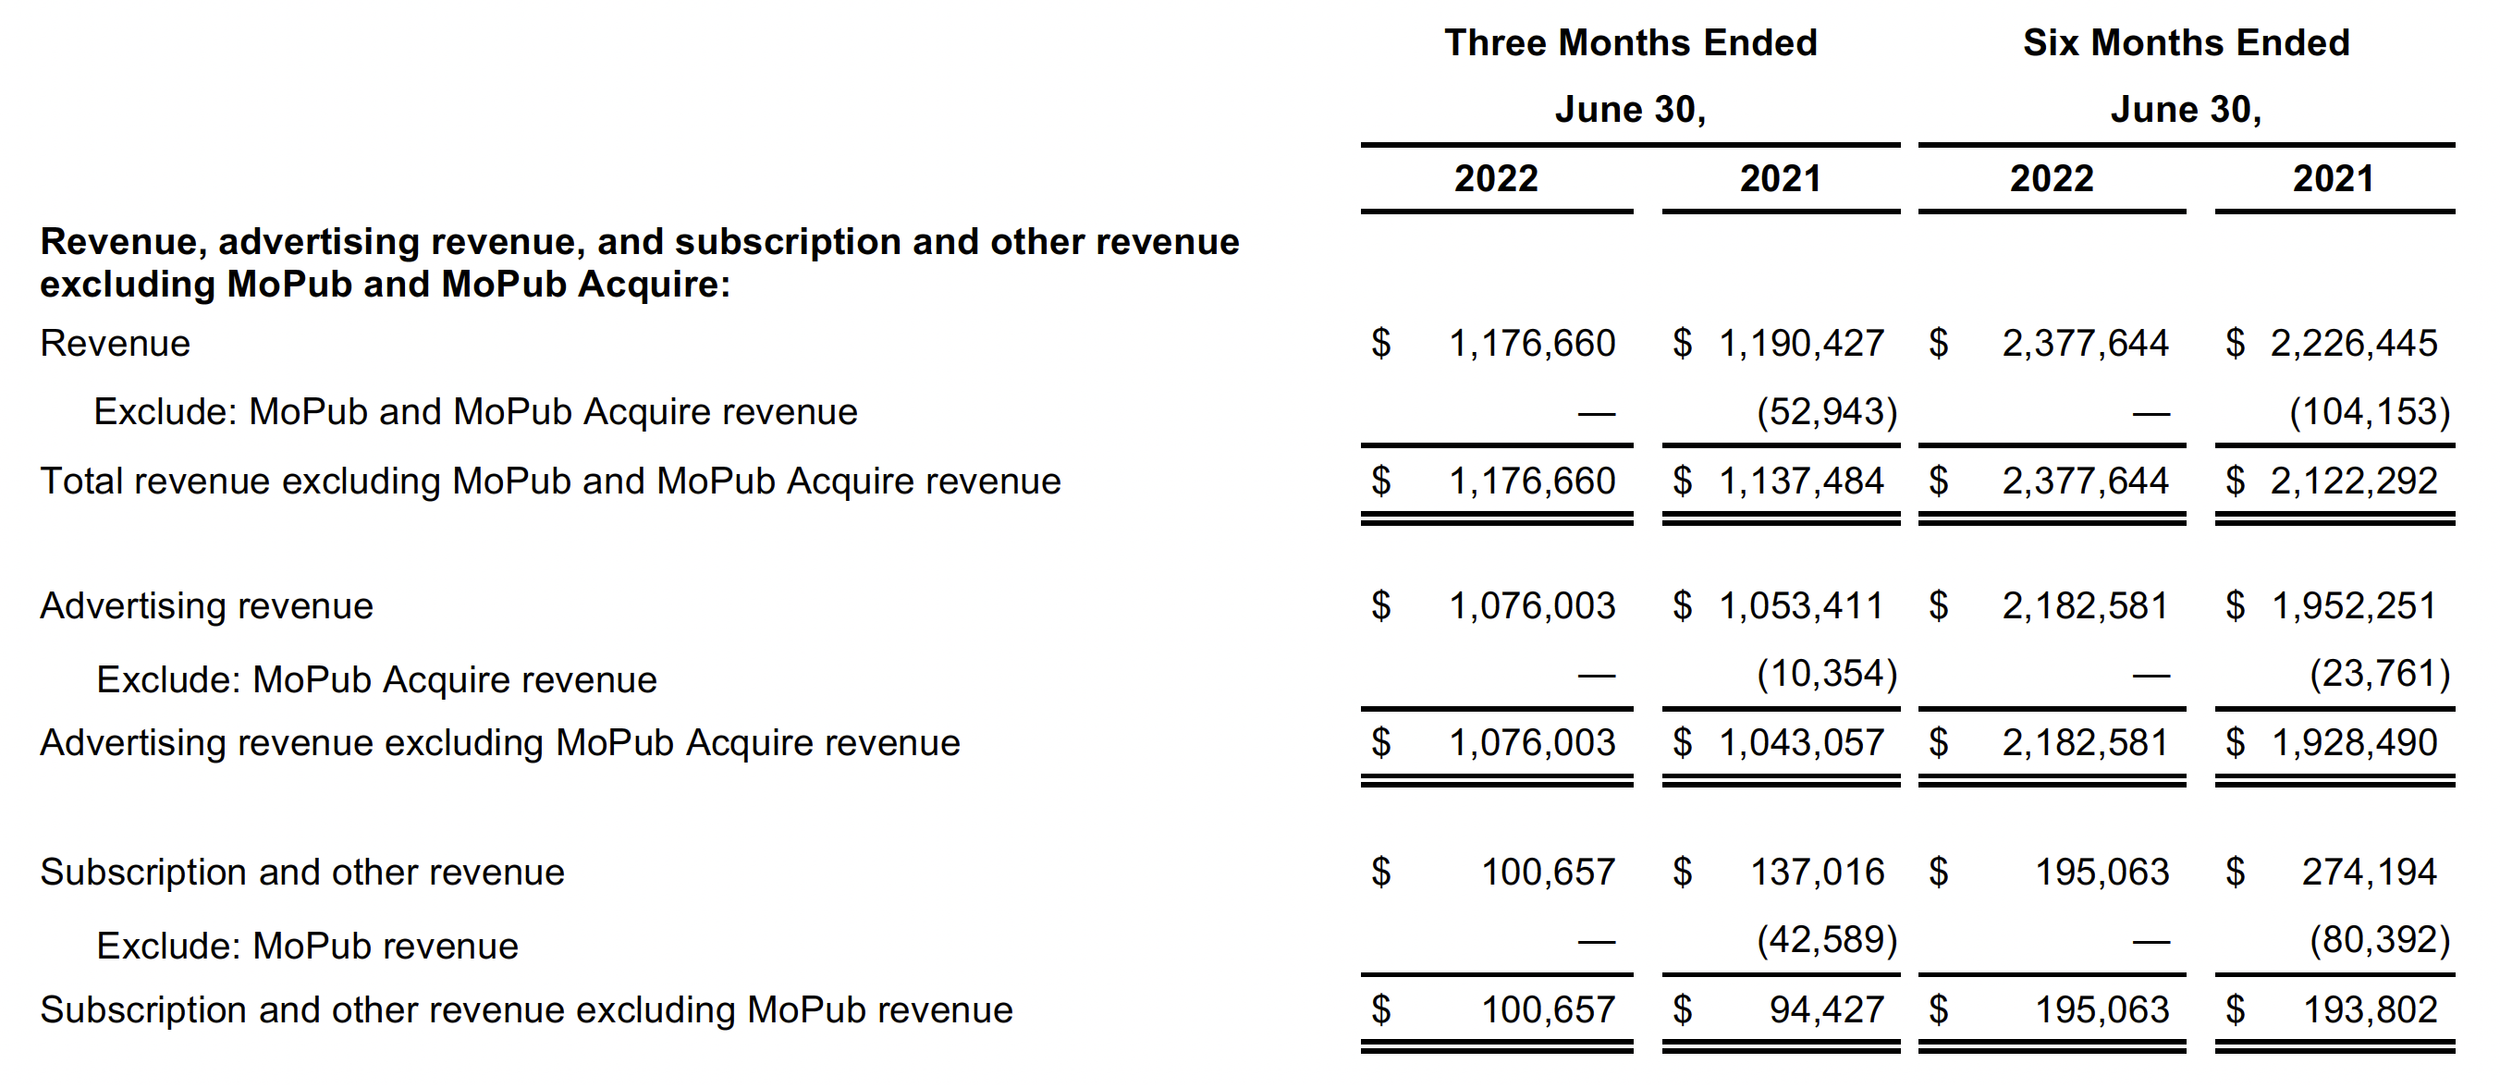
Alarmingly though, media reports indicate that more than half of Twitter’s top advertisers stopped spending on the platform following Musk’s acquisition, leading to a 65 percent drop in ad revenues between October 2022 and January 2023.
In a recent interview, Musk said that “most” of these advertisers have returned, but he didn’t offer any specific numbers to back up his claim, and analysts remain sceptical.
Twitter launched a number of new revenue streams since Musk took over in October though, including a USD $8 monthly subscription to Twitter Blue, and a USD $1,000 monthly charge for companies to be recognised as a “Verified Organisation”.
As a result, it’s tricky to know how Twitter’s current revenues might break down.
However, TechCrunch cited data from Sensor Tower suggesting that Twitter Blue had generated an “underwhelming” USD $11 million via mobile signups by late March 2023.
Meanwhile, Vox cited Similarweb data indicating that just 116,000 users had subscribed to Twitter Blue by the end of March 2023.
That figure had more than doubled since the month before – an encouraging trend – but the March 2023 total still equated to less than 0.05 percent of Twitter’s last official mDAU figure.
And in an even starker assessment of Twitter’s subscription drive, Similarweb analysis suggests that current users are “six to ten times more likely to quit” Twitter than they are to pay for Twitter Blue.
In other words, even if ad revenues have been cut in half, they’re still essential to Twitter’s survival, and likely still account for the vast majority of Twitter’s revenues.
However, a sharp drop in advertiser numbers isn’t the only issue affecting Twitter’s advertising outlook.
Twitter’s advertising reach
Despite a number of hiccups in recent weeks, Twitter still publishes regularly updated numbers to its own Ads Manager tool.
Crucially, these numbers detail how many user accounts advertisers might be able to reach with ads on the Twitter platform.
Somewhat confusingly, the company’s potential advertising reach figures appear to reflect monthly use of its platform, as opposed to the daily activity figures that it previously reported to investors.
The company’s own guidance to advertisers also clarifies that these potential ad reach figures shouldn’t be used as a proxy for active users:
“It is important to note that [ad reach] data does not represent monetisable daily active users (mDAU), monthly active users, or any other actual Twitter audience metrics.”
Caveats aside though, the company’s ad reach figures should – at least in theory – provide valuable insights into Twitter’s own analysis of how many people are using its platform, and therefore offer a perspective on changes in the platform’s overall user base.
However, our analysis of the company’s ad reach data has revealed a number of recent anomalies and incongruities.
A quick guide to Twitter’s ad reach estimates
It’s worth noting that we’ve been collecting, reporting, and analysing the ad reach estimates published in Twitter’s official Ads Manager tool since July 2018, as part of our ongoing Global Digital Reports series.
And our analysis of almost five year’s worth of data shows that the figures published in Twitter’s Ads Manager tool have always been susceptible to mysterious fluctuations, even over relatively short periods of time.
However, as we’ll explore in detail below, those fluctuations have become more pronounced in recent weeks, leading to some alarming trends in the company’s own, published data.
But before we draw any conclusions from these numbers, it’s worth clarifying that a number of other issues may affect the representativeness of the data published in Twitter’s Ads Manager tool.
Potential data distortions
For context, Twitter hasn’t historically required users to enter any personal details when signing up for an account, and as a result, the company must “infer” – i.e. guess – many of the traits that advertisers rely on to target their ads.
And our analysis suggests that these inferences may lead to distortions in the company’s reported numbers.
For example, Twitter’s own data suggests that roughly two-thirds of its global ad audience is male, meaning that women account for just 1 in 3 of its active users at a worldwide level.
But this gender ratio is quite different to the ones that we see in third-party datasets, including those based on large-scale surveys.
For example, GWI surveys hundreds of thousands of internet users in 50 countries every quarter, and the company’s data shows that – over the past two years – the gender balance of Twitter’s active user base has averaged 42 percent female versus 58 percent male.
Meanwhile, a 2021 study conducted by Pew Research found that 25 percent of male adults in the United States use Twitter, compared with 22 percent of women – figures that suggest an overall audience gender balance of roughly 47.5 percent female versus 52.5 percent male.
So, even though figures are published in the company’s own, official tools, Twitter’s ad reach data may not be “perfect”.
Sh*tty responses
But even the company’s process for delivering its ad reach data offers insight into what might be going on at Twitter today.
For example, we contacted Twitter on numerous occasions and through various different channels – Twitter handles, online forms, and email addresses – to enquire about the anomalies we detected in their data, but the only “official” response we received was this absurd reply from Twitter’s press email account:

We’re not alone in receiving this puerile response though, and as you can see in Elon Musk’s tweet below, the poop emoji now appears to be the standard auto-response to every email sent to the company’s “official” press enquiries address:
press@twitter.com now auto responds with 💩
— Elon Musk (@elonmusk) March 19, 2023
In the hopes of getting more meaningful insight, we also spoke with a number of current and previous Twitter employees, but none was willing to talk on the record about the anomalies that we detected in the company’s ad reach estimates.
However, a few hours after we sent an email to senior Twitter executives detailing the issues that we’d detected, the company removed all published reach estimates from its Ads Manager tool, and replaced that data with a revised set of figures roughly 24 hours later.
Both sets of data were published in the company’s own official tools though – and were both publicly visible for a period of not less than 72 hours – so we’ll explore both of them as part of this analysis.
Trends in Twitter’s ad reach
For perspective, back in January 2023, figures published in Twitter’s official Ads Manager tool indicated a worldwide ad audience of 556 million user accounts.
That figure had increased by 12 million – or 2.1 percent – versus the equivalent data published in the same tool in October 2022, and it was 120 million – or 27.4 percent – higher than the figures published in January 2022.
Round 1: reach falls by two-thirds
However, when we collected an initial round of Twitter data for our April 2023 report, figures published in the company’s own tools suggested that global ad reach had fallen by an average of 68 percent in the space of just three months, to just 177.2 million.
Interestingly, this rate of decline was relatively consistent across geographies, with figures for all but four countries out of a total of 214 showing a drop in reported reach of between 60 and 80 percent.
It was at this point that we started to contact Twitter requesting comment on these anomalies, leading to the company’s eventual removal of these figures from its Ads Manager tool.
Round 2: reach falls by one-third
The company then published a new, “revised” set of data to the same tool on April 20th, but these updated figures still show a meaningful decline in potential Twitter reach versus the January figures cited above.
Change figures for individual countries are more varied compared with those we saw in the first round of data, and two countries – Turkmenistan and Ethiopia – actually registered an increase in potential Twitter ad reach.
However, a total of 20 countries also registered a quarter-on-quarter decline in excess of 50 percent.
At the time of writing, figures published in Twitter’s Ads Manager indicate potential global reach of 372.9 million, which is still roughly 33 percent (183 million) below the global total that the same tool reported just three months ago.
That’s significantly better than the 68 percent drop that we saw in the first round of data, but a 33 percent quarter-on-quarter decline is still the biggest drop I can recall in more than 10 years of tracking this kind of data, regardless of the platform.
Note that the figures shown in the chart below are the same figures you’ll find in our April 2023 April Global Statshot Report.

Are these figures for real?
In the absence of any meaningful comment from Twitter regarding these recent changes, it’s unclear whether Twitter will update these figures again in the days after we publish this report.
However, given that the “revised” numbers detailed above were published in Twitter’s own, “official” tools – following what appears to have been a correction in the data – it seems safe to assume that these revised figures were officially sanctioned by Twitter’s ads team at some point.
As a result, any subsequent changes in these published numbers would be no different to the regular corrections that we see in Meta’s published ad reach estimates.
So, the clear takeaway here is that Twitter’s reported ad reach has fallen significantly over the past three months.
Declining traffic to Twitter’s ad tools
But this trend isn’t just evident in Twitter’s own data.
For example, analysis by Similarweb confirms an 18 percent year-on-year drop in visits to web URLs associated with Twitter’s Ads Manager in March 2023.
However, Twitter’s Ads Manager tool is primarily designed for smaller advertisers, and most of the platform’s larger advertisers will likely book Twitter media through a dedicated tool, potentially with the help of an agency partner.
Moreover, declining ad reach may be the result of various factors, and not all of these relate to changes in overall Twitter use.
Indeed, while it might seem counterintuitive, social media platforms regularly report declines in ad reach whilst simultaneously reporting growth in active users.
For example, figures published in Meta’s Ads Manager tool showed a 4.6 percent decline between October 2022 and January 2023, but the company’s investor earnings announcement reported an increase in monthly active users (MAU) of 0.2 percent for the same period.
As a result, the changes in Twitter’s reported ad reach may not correlate with a similar change in Twitter’s overall active user base.
Either way though, a key question remains: what did cause that 33 percent drop in Twitter’s reported reach?
In the absence of official company statements, it’s tricky to offer any definitive conclusions here, but let’s explore a few hypotheses.
Potential causes of declining Twitter ad reach
Before we dive in, note that this section is purely speculative, and there may be other factors to consider beyond the considerations outlined below.
1. Twitter’s Ads Manager tool might be broken
Hypothesis: Twitter’s Ads Manager may simply be broken, and – with Twitter losing more than 80 percent of its workforce since October – nobody had fixed it by the time of writing.
Analysis: Shortly after we sent Twitter details of anomalies in its Ads Manager tool, the company removed all the associated data. However, the company then replaced that data with a new set of numbers, and if the Ads Manager tool were indeed broken, it seems more likely that the company would have stopped publishing this data altogether. So, this is a less likely option.
2. Updates may not include complete data
Hypothesis: Despite the published corrections, Twitter’s ad reach estimates may still rely on incomplete data. For example, if the Ads Manager tool reports potential ad reach based on a three-month rolling average, and new data has only been added for one or two months instead of three, we might expect the latest figures to be roughly two-thirds or one-third lower (respectively) than the figures published in January.
Analysis: Given the size of the declines that we saw in the two “rounds” of data that we collected – i.e. a 68 percent drop in the initial dataset, and a 33 percent drop in the updated numbers – this hypothesis may be worthy of additional investigation. However, because there’s no way to go “back in time” with Twitter’s ads tools to see historical data, this could be tricky.
3. Previous data may have been incorrect
Hypothesis: Rather than current datasets being the source of apparent anomalies, the problem may actually arise from inaccuracies in previously published data.
Analysis: Twitter’s reported ad reach jumped by 12 percent between July and October 2022, which seems unusually high considering how long Twitter has been around. However, that wasn’t the first time that we’ve seen double-digit quarterly growth in Twitter’s ad reach numbers, and for context, the current figures appear to have “undone” roughly two full years of growth. However, with all the confusion at Twitter in the last few months of 2022, there was perhaps an increased likelihood of human error creeping into published datasets.
4. Previous figures may have been distorted by bots
Hypothesis: Recent changes restricting free access to Twitter’s API may have resulted in a significant drop in bot traffic, resulting in far fewer active accounts.
Analysis: A 33 percent drop in active accounts would correlate neatly with Musk’s own projections of the scale of bot activity on Twitter prior to completing his acquisition. However, this hypothesis doesn’t really explain the difference between the two different “rounds” of data that we collected, so – while a drop in bot activity might be an important factor to consider when analysing overall Twitter user numbers – it wouldn’t fully explain the trends in this ad reach dataset. Moreover, analysis from Similarweb suggests that bot traffic is likely much lower than Musk’s court documents alleged.
5. Ad reach estimates may depend on historical reach
Hypothesis: Just as we see with some other social platforms, Twitter’s ad reach estimates may depend on how many people saw ads on Twitter in the recent past, rather than how many people used the platform overall. For comparison, guidance in Meta’s Ads Manager states that the company’s estimates of potential reach depend at least in part on “how many accounts were shown ads across Meta technologies and services in the past 30 days”. As a result, it’s plausible that Twitter uses a similar approach too.
Analysis: Various media reports suggest that a large number of companies have stopped advertising on Twitter in recent months. That change may have resulted in significantly fewer users being served ads on Twitter, which may in turn have resulted in reductions to forward-looking reach forecasts.
6. Twitter may be moving away from ads
Hypothesis: Musk and team may have decided to ‘deprioritise’ advertising, in favour of more diversified sources of revenue like subscriptions.
Analysis: Given the continued importance of ad revenues to Twitter’s survival (as we explored above), this hypothesis seems improbable, but Musk’s own public comments about ads on Twitter mean it’s not entirely impossible.
7. Fewer people might be using Twitter
Hypothesis: The decline in reported ad reach might be the result of an equivalent drop in overall platform use.
Analysis: While it’s tempting to draw this conclusion, our analysis of various data points suggests that a decline in overall active user numbers probably isn’t the primary cause of the current decline in reported ad reach.
That previous sentence will likely be too glib for our more discerning readers though, so let’s explore those “various data points” in more detail.
Trends in active Twitter use
First up, our conversations with Twitter execs indicate that the company’s internal figures still showed strong, double-digit user growth over the final three months of 2022.
We also reported strong growth in Twitter ad reach for that same Q4 2022 period though, and as we’ve already seen, trends in that data suggest things may have changed dramatically in the first three months of 2023.
Meanwhile, in media interviews, Musk insists that Twitter is now enjoying “record high usage”.
However, the wording of his assertion suggests that he may have been referring to metrics other than active user numbers, such as the “new record” of 8 billion “user minutes” that he revealed in a tweet on March 19th.
And our analysis suggests that – even if Twitter’s internal data does show “user growth” – that trend may be based on a change in active accounts, rather than growth in active individuals.
Individuals, users, accounts…
To be fair to Twitter, it’s nigh on impossible for any social media company to identify how many unique “humans” use its platform, and – as I noted earlier – Twitter’s mDAU figures always included “non-human” entities such as businesses, places, pets, and bands, in addition to human individuals.
Similarly, all social media platforms acknowledge the challenges associated with deduplicating their user bases.
For example, in its 2022 Q4 investor earnings report, Meta stated that while its numbers:
“… are based on what we believe to be reasonable estimates of our user base for the applicable period of measurement, there are inherent challenges in measuring usage of our products… The methodologies used to measure these metrics require significant judgement and are also susceptible to algorithm or other technical errors.”
Later in that same report, the company goes on to note the impact that issues such as “false” and “duplicate” accounts may have on monthly active Facebook users (MAU):
“In the fourth quarter of 2022, we estimated that duplicate accounts may have represented approximately 11% of our worldwide MAUs [… and] that false accounts may have represented approximately 4-5% of our worldwide MAUs.”
In other words, Meta estimates that such accounts may inflate Facebook’s published user numbers by more than 15 percent – a figure that would equate to more than 440 million active accounts.
Before Musk’s acquisition, Twitter’s guidance to investors included similar statements, but the company quoted figures that were considerably lower than Meta’s estimates:
“[T]here are a number of false or spam accounts in existence on [Twitter]. We have performed an internal review of a sample of accounts and estimate that the average of false or spam accounts during the second quarter of 2022 represented fewer than 5% of our mDAU during the quarter.”
But – tellingly – the same guidance goes on to concede:
“In making this determination, we applied significant judgement, so our estimation of false or spam accounts may not accurately represent the actual number of such accounts, and the actual number of false or spam accounts could be higher than we have estimated.”
Prior to his acquisition, Musk seemed to concur wholeheartedly with the last part of that statement, and his concerns about “spam bots” nearly derailed his Twitter acquisition.
Indeed, in official court documents, Musk and his team alleged that a hefty 33 percent of Twitter’s “visible” accounts might be bots, although it’s probably pure coincidence that this figure aligns so neatly with the decline in ad reach detailed above.
But as we now know, the billionaire eventually put his qualms about bots aside, and completed his Twitter purchase.
However, Musk’s tweets still regularly allude to continued frustration with spam and bot activity on the platform he now controls.
And critically, despite Similarweb’s assertions that Twitter’s bot traffic is likely closer to its previous owners’ estimates than those quoted in Musk’s 2022 court documents, there’s still a possibility that bot activity does indeed skew the user figures that Twitter sees in its own data.
But how might Twitter’s own user figures compare with reliable, third-party data?
Let’s take a look at a few key numbers.
Use of Twitter’s Mobile App
Mobile apps aren’t the only ways in which people can access social media, but data suggests that more than 95 percent of the users of most top platforms use the respective mobile app for at least some of their activity in any given month.
As a result, app tracking offers some of the most reliable insights into how people use social media.
Monthly active users
Analysis conducted by data.ai suggests that the number of users who opened Twitter’s Android app remained largely unchanged across the last three months of 2022, even as downloads of the app surged by more than 20 percent during the same period.
However, for comparison, data.ai’s tracking data shows that most of Twitter’s peers saw monthly active app use figures increase during this period.
Moreover, data.ai’s analysis indicates that 2.5 percent fewer users opened Twitter’s Android app in the first three months of 2023, as compared with the final three months of 2022.
data.ai’s active user figures do offer some good news for Musk and team, with trends showing that 2 percent more users opened Twitter’s Android app in Q1 2023 compared with Q1 2022.
However, for perspective, a separate analysis of Android app activity published by Similarweb suggests that Twitter may have lost between 5 and 10 percent of its monthly active users over the past year.
Trends in app engagement
Meanwhile, other metrics in data.ai’s tools indicate that Twitter’s performance may not be as strong as Musk’s recent comments suggest.
Trends comparing Twitter’s Android app activity in the first three months of 2023 with the last three months of 2022 show that:
Worldwide app downloads declined by 4 percent quarter on quarter (QOQ);
Average monthly active users dropped by 2 percent QOQ;
The average number of sessions per user, per month declined by 2 percent QOQ;
Average monthly time spent using the app per user fell by 2 percent QOQ.
There were some more encouraging signs in the same data too, though:
Twitter’s daily app open rate remained unchanged QOQ;
Average session duration increased by close to 1 percent QOQ.
However, the overall conclusion here is that worldwide Twitter use may be in decline – at least when it comes to humans using the platform’s mobile app.
But users can also access social media platforms via web browsers, so it’s well worth exploring trends in Twitter’s web traffic too.
Traffic to Twitter.com
Just before we explore this data, it’s important to highlight that visitors to a platform’s website may not necessarily sign into or use the respective platform.
Furthermore, it’s hard to identify when the same person visits a website from different devices or browsers, so figures for “unique visitors” may be more representative of unique access devices than unique individuals.
As a result, web traffic figures should not be used as a proxy for the monthly active users of any social platform.
And this is particularly true in the case of Twitter, because people can readily access content published to Twitter even if they haven’t signed up for – or signed into – a Twitter account.
That being said though, there’s nothing to stop Twitter from monetising website visitors who don’t sign into the service, so web traffic data still has distinct value.
Twitter is still one of the world’s most popular websites
And the first thing to highlight is that Twitter is still one of the world’s top ten websites.
Data from Semrush shows that Twitter.com placed sixth in the company’s ranking of the most visited web domains in the world in March 2023, with a total of 2.3 billion unique “visitors”.
Meanwhile, Semrush’s data shows that the typical “visit” to Twitter.com lasted 20 minutes and 41 seconds, which was longer than the typical visit to Facebook.com.
Similarweb’s published ranking of the world’s top websites offers fewer metrics compared with the Semrush data above, but Similarweb’s data still offers good news for Musk and team.
In particular, Similarweb ranked Twitter fourth at a worldwide level in March 2023, with only Google.com, YouTube.com, and Facebook.com attracting a greater number of visits that month.
Similarweb’s data also suggests that visits to Twitter.com lasted longer than visits to Facebook.com, although the specific numbers are quite different to those that we saw in Semrush’s data above.
Digging deeper: trends in web traffic over time
However, once we start to look at trends over time, things start to get more complicated.
For example, Semrush’s data suggests that unique visitors to Twitter.com have increased steadily over the past year.
The 2.3 billion figure that the company’s tools show for unique visitors in March 2023 is roughly:
4.5 percent higher than the figure for February 2023 (2.2 billion)
9.5 percent higher than the figure for December 2022 (2.1 billion)
21 percent higher than the figure for September 2022 (1.9 billion)
35 percent higher than the figure for March 2022 (1.7 billion)
However, data published by Similarweb paints a less rosy picture of Twitter’s recent performance.
In a detailed article examining traffic to Twitter’s various web presences, Similarweb’s Senior Insights Manager, David Carr, states that:
“From what we can see, Twitter usage by the general public, which was still rising in late 2022, has been declining since the beginning of 2023.”
Carr goes on to offer the following data points to support that assertion:
Worldwide visits to Twitter.com dropped 7.3 percent year-over-year (YOY) in March 2023, the third straight month of declines.
Twitter.com’s unique visitors declined 3.3 percent YOY in March 2023.
Average visit time on Twitter’s website was down slightly to 10.6 minutes in 2023, from 10.7 in March 2022.
Average pages per visit dropped by 1.5 percent YOY.
Twitter quitters
Given the differences between the data published by Semrush and Similarweb, it’s tough to derive a strong conclusion from this web traffic data.
However, Carr’s article offers an even more striking data point.
By analysing web traffic to the URL associated with the completion of Twitter’s account deactivation process, Similarweb has been able to offer tangible figures for the number of users who may be “quitting” Twitter.
Carr’s analysis suggests that more than 1 million users permanently closed their Twitter accounts in March 2023.
However, this figure doesn’t tell the full story, because – as Carr’s article concedes – the current rate of “departures” is actually lower than it was a year ago – i.e. before Musk even announced he intended to take over the platform:
“Confirmed quitter account deactivations… which peaked at 1.75 million around the time Musk assumed control of the company in November 2022, have subsided to 1.1 million in March – 11 percent lower than they were a year ago.”
So, while Musk’s acquisition did appear to result in a short-term spike in “Twitter quitters” in October 2022, the data suggests that fewer people quit the platform in March 2023 than did before Musk took over.
Moreover, none of these traffic figures suggest that a decline in active user figures might be anywhere close to the 33 percent decline that we saw in Twitter’s reported ad reach data.
Conclusions
So what does all of this data tell us?
Well, my extensive analysis suggests that Twitter use may be slipping, but it’s certainly not in freefall.
More specifically, the platform’s worldwide active user base may be a few percentage points smaller than it was at the start of 2023, but this doesn’t imply that Twitter is “dying”.
Moreover, there’s nothing to say that users who stopped using Twitter over recent weeks won’t return in the future.
However, the data does suggest that those users who remain may be using the platform less frequently than they used to.
And perhaps most importantly, the significant decline – and large fluctuations – in Twitter’s own ad reach forecasts will likely do little to encourage departed advertisers back to the platform.
So, while trends in platform use might not be cause for immediate concern, the platform’s financial performance may result in more nights at the office for Musk and team for the foreseeable future.
Update: yet more revisions
As I suspected, Twitter published yet another round of corrections to its ad reach estimates, just as we published this study.
These new figures suggest that the platform’s ad reach estimates may have increased again, but my initial analysis indicates that the revised global total will still be lower than the equivalent figure for January 2023.
However, as I noted above, Twitter’s tools have always been prone to regular updates and fluctuations, and I wouldn’t be surprised to see further updates over the coming days.
On the one hand, such regular updates can be helpful for advertisers looking for the most “up to date” figures to inform their plans.
However, just as unpredictable performance can spook stock markets, so advertisers may find constant swings in Twitter’s ad reach estimates more confusing than helpful.
But fear not: provided the company continues to publish data to its advertising tools, we’ll bring you the latest updates on the evolution of Twitter’s ad reach numbers in the upcoming editions of our Global Digital Reports.
Recommendations for further reading
If you’d like to compare Twitter’s recent performance against that of its peers, you’ll find detailed data for all of the world’s top social media platforms in our Digital 2023 April Global Statshot Report, as well as in our regularly updated platform audience reports.
In addition to these DataReportal resources, you may also find the following articles useful:
Vox: “Is Twitter finally dying?”, 15 April 2023
TechCrunch: “Twitter Blue relaunched has made just $11M on mobile in its first 3 months”, 25 March 2023
Similarweb: “Twitter is Shrinking”, 17 April 2023, and “Twitter Users 6-10 Times More Likely to Quit Than Buy Twitter Blue”, 20 April 2023
CNN Business: “More than half of Twitter’s top 1,000 advertisers stopped spending on platform, data show”, 13 February 2023
The Hill: “Musk, media reach boiling point over Twitter changes”, 18 April 2023
Disclosure: Simon Kemp is a brand advocate for data.ai.