
Digital 2022: October Global Statshot Report
Open any news app or social media feed today, and you’re likely to encounter various stories relating to digital trends.
These stories often lead with attention-grabbing headlines, and many include a startling statistic or two.
However, the data in our new Digital 2022 October Global Statshot Report – published in partnership with We Are Social and Hootsuite – suggest that many of these headlines distort our digital reality.
So, if you’re looking to understand what the world is really doing online, the good news is that you’re in the right place – simply read on below.
Essential takeaways
If you’re short on time, the YouTube video below will guide you through ten of the top stories in this quarter’s data.
However, read on below that for our complete October report, and for my comprehensive analysis of this quarter’s key insights and trends.
Top stories in digital in October 2022
In addition to all of our usual data points, essential stories in this quarter’s report include:
A big new milestone for the global population
A decline in a key internet usage metric
The outlook for Facebook in the months ahead
Valuable perspectives on the growth of the Metaverse
Changes at the top of a key social media ranking
Intriguing trends in TikTok behaviour
The rise of connected TVs and podcasts
A big new number for mobile data traffic
Some surprising insights into how people view cookies
A ranking of the world’s top shopping apps
And with this being our last report of 2022, I’ll finish up this quarter’s analysis with my take on the key themes and trends that I believe will shape and define digital success in 2023.
Just before we dive into all of those stories though, please read the following notes carefully, to ensure that you understand how recent changes in underlying data and research methodologies may impact this quarter’s findings.
Important notes on data changes
Major source “corrections” in social media ad reach figures: since our July 2022 report, Meta appears to have begun revising the ways it calculates and / or reports potential audience reach. Notes in the company’s ad planning tools suggest that these revisions are ongoing, but the figures that these tools now report for ad reach across Facebook, Instagram, and Messenger are already meaningfully lower than the figures that the same tools reported just a few months ago. We’ll explore these changes in more detail below, but please note that – as always – the latest figures for these platforms may not be directly comparable with similar figures published in our previous reports.
To learn more about other changes that may impact the comparability of data across reports in the Global Digital Reports series, please refer to our comprehensive notes on data.
Complete Digital 2022 October Global Statshot Report
You’ll find the complete Digital 2022 October Global Statshot Report in the SlideShare embed below (click here if that’s not working for you).
But what does all of this data mean for you?
Let’s get stuck into all of the numbers to find out…
The global state of digital
Let’s begin with the latest global digital headlines:
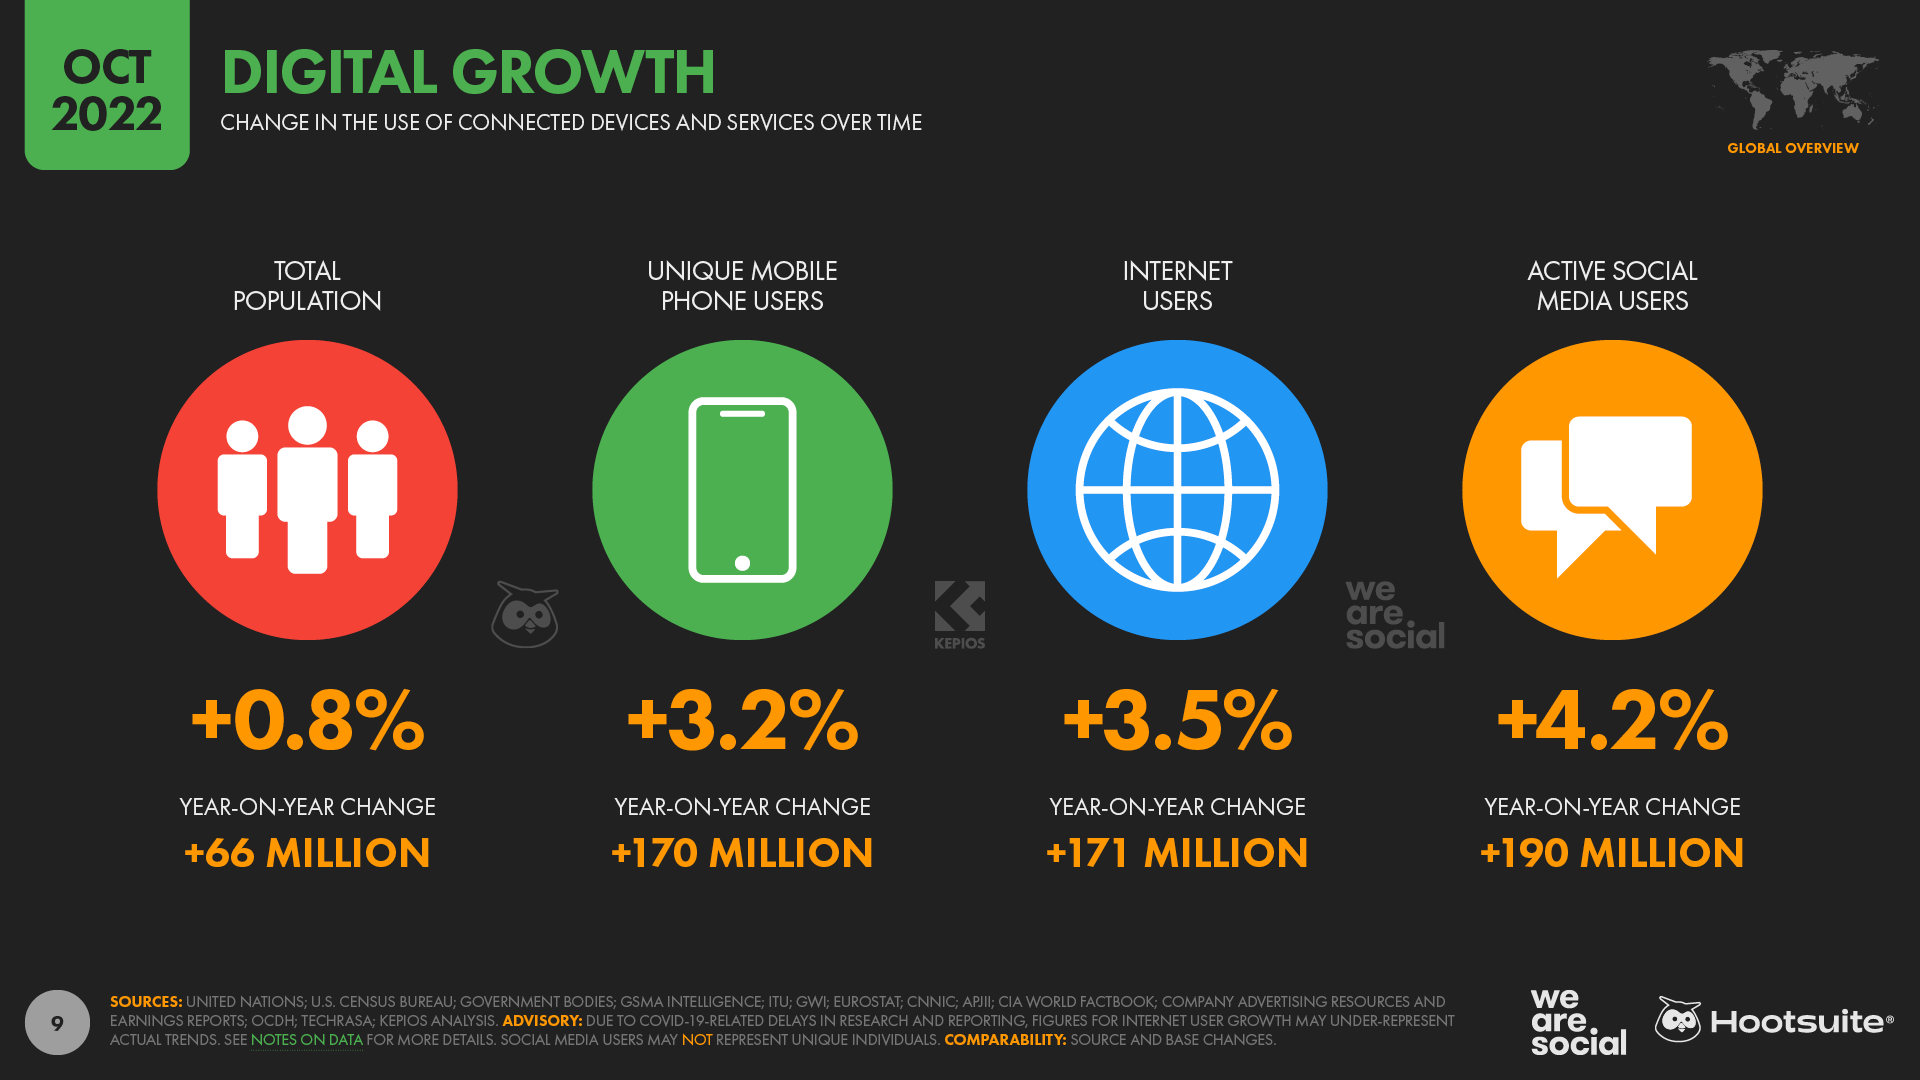
The global population stood at 7.99 billion at the start of October 2022, and – as we’ll see below – we’ll reach the momentous 8 billion mark just a few days after we publish this report.
Global mobile users have reached 5.48 billion, with smartphones accounting for almost 4 in 5 of the mobile handsets in use today. The world’s mobile user base has grown by 170 million since this time last year, with 68.6 percent of all the people on Earth now using some form of mobile phone.
Internet users increased by 3.5 percent in the year to October 2022, reaching 5.07 billion as we enter the final quarter of the year. 171 million new users over the past 12 months have taken global internet penetration to 63.5 percent.
Social media users grew by 190 million over the past year, to reach a total of 4.74 billion at the start of October 2022. That global total has increased by 4.2 percent over the past 12 months, and social media users now equate to 59.3 percent of the world’s total population.
Global Digital Growth October 2022 DataReportal
OK, ready to dig deeper into all of these numbers?
Let’s go…
Global population set to pass 8 billion
Forecasts from the United Nations’ Department of Economic and Social Affairs show that the world’s population will reach a big milestone over the next few days, with the number of people living on Earth set to reach 8 billion on 15 November 2022.
The UN’s recently revised global population figures reveal that this latest milestone comes just 12 years after the global population passed 7 billion, in September 2010.
Commenting on the UN’s latest forecasts, Secretary-General António Guterres said:
“This [milestone] is an occasion to celebrate our diversity, recognise our common humanity, and marvel at advancements in health that have extended lifespans and dramatically reduced maternal and child mortality rates. At the same time, it is a reminder of our shared responsibility to care for our planet and a moment to reflect on where we still fall short of our commitments to one another.”
The world’s most populous countries
At the start of October 2022, the populations of 14 countries already exceeded 100 million people:
China: 1.43 billion people
India: 1.42 billion people
The United States of America: 339 million people
Indonesia: 276 million people
Pakistan: 237 million people
Nigeria: 220 million people
Brazil: 216 million people
Bangladesh: 172 million people
Russia: 145 million people
Mexico: 128 million people
Ethiopia: 124 million people
Japan: 124 million people
The Philippines: 116 million people
Egypt: 111 million people
The Democratic Republic of the Congo only just failed to qualify for this list though, and by the time you read this article, the country’s population should already have passed the 100 million mark.
For perspective, China and India alone account for more than one-third (35.6 percent) of today’s global population.
However, the United Nations reports that India will overtake China to become the world’s most populous country by the middle of 2023.
Meanwhile, just 17 countries – the 14 listed above, plus the Democratic Republic of the Congo, Vietnam, and Iran – account for more than two-thirds (66.8 percent) of the global population in October 2022.
Global population growth
The world’s population is currently growing by 0.84 percent per year, which the United Nations reports is the slowest annual growth rate since the 1950s.
Despite that slowdown in growth, however, the global population is still on track to reach 9 billion by 2037, and the UN’s projections indicate that the worldwide total could reach 10 billion before the end of the 2050s.
Just eight countries will contribute more than half of the growth towards that 10 billion figure: the Democratic Republic of the Congo, Egypt, Ethiopia, India, Nigeria, Pakistan, the Philippines, and Tanzania.
For context, these eight countries currently account for about 30 percent of the global total.
However, the latest data suggest that the world’s population won’t continue to grow indefinitely.
The UN forecasts that the global total will peak at around 10.4 billion in the mid-2080s, before declining slowly towards the end of the century.
Education levels and improvements in gender equality will play an important role in this deceleration – and eventually reversal – of population growth.
As Liu Zhenmin, Under-Secretary-General for Economic and Social Affairs remarked,
“The relationship between population growth and sustainable development is complex and multidimensional. Rapid population growth makes eradicating poverty, combating hunger and malnutrition, and increasing the coverage of health and education systems more difficult. Conversely, achieving the Sustainable Development Goals, especially those related to health, education and gender equality, will contribute to reducing fertility levels and slowing global population growth.”
In perspective
The latest total of 8 billion people may sound like a lot, but humanity still has nothing on ants.
A study published last month in the prestigious Proceedings of the National Academy of Sciences (PNAS) suggests that there are at least 20 quadrillion ants on Earth today.
In simpler terms, that’s 20 million billion – or 20,000,000,000,000,000 – which means that there are roughly 2.5 million ants for every human on the planet.
In terms of biomass, humans still outweigh ants by a factor of 5 to 1, but – at 12 billion kilograms of carbon – the cumulative weight of all the ants on Earth is now greater than the mass of all wild birds and wild mammals combined.
So, there’s plenty of evidence to suggest that working together for a common good has its benefits.
Looking ahead: an ageing population
Returning to the human population, another interesting trend in the latest data relates to the steady “ageing” of the global population.
The UN projects that people aged 65 and above will account for 16 percent of the global population by 2050, which would represent relative growth of more than 50 percent compared with that age group’s current share of 10 percent.
Furthermore, by 2050, the number of people aged 65 and above will match the number of people aged 12 and below, while the over-65s will outnumber children aged 5 and below by a factor of more than 2 to 1.
This ageing trend has various implications for our societies and the global economic outlook, but it has particular importance for marketers, who have historically tended to overlook older age groups.
Indeed, one clear takeaway from this data is that it’s high time for marketers to rethink their “fetishisation of youth” – especially because older age groups are particularly likely to feel left out by our current marketing activities.
Internet users to reach “supermajority” status in 2023
The latest research from the ITU and GSMA Intelligence indicates that more than two-thirds of the world’s population will be using the internet by the end of 2023.
For clarity, this means that twice as many people will be online as offline, resulting in internet users achieving “supermajority” status.
However, our ongoing analysis suggests that user growth will continue to slow over the coming years, especially after the surge in digital adoption that we saw during the COVID years.
The latest available data suggest that global internet users grew by just 3.5 percent in the year to October 2022, equating to less than half a million new users each day.
For reference, with 171 million new users over the past year, the latest internet growth figure is 23 percent lower than the annual increase that we reported this time last year.
It’s worth highlighting that we’re expecting some significant updates in internet user numbers from both the ITU and GSMA Intelligence in the coming weeks though, so we may see a meaningful upward correction in the global user total in time for our January report next year.
However, these revisions will likely include updates to historical numbers too, and we expect that these updated numbers will still point to slowing user growth in 2023 and beyond.
Internet time slides
But it’s not just user growth that’s slowing.
Research from our partners GWI reveals that the average amount of time that people spend on the internet each day has also been edging downwards over recent months.
The company’s latest wave of data reveals that the typical working-age internet user now spends 6 hours and 37 minutes using connected devices and services each day, which is 20 minutes per day less than the 6 hours and 57 minutes per day we spent online this time last year.
That equates to a 4.8 percent year-on-year decline, and means that people now spend less time online than they did in Q2 2019, well before the COVID-19 pandemic redefined the world’s digital behaviours.
GWI’s historical data shows that people spent an average of 6 hours and 41 minutes per day using the internet between April and June 2019, meaning that the most recent average is 4 minutes per day – or 1 percent – lower than it was this time three years ago.
Interestingly, daily online time has fallen consistently across almost all of the 48 countries in GWI’s survey over the past three months, with only four countries registering an increase: Czechia, Ireland, Romania, and South Africa.
The data also reveal declines across all age groups, although the steepest drops appear to have occurred amongst users aged 55 to 64.
Indeed, women in this age group say they spent a full 26 minutes less online each day in Q2 2022 compared with the previous quarter, equating to a drop of 7.5 percent in just 3 months.
At a global level, only women aged 35 to 44 say that they’re spending more time online today than they did three months ago, but at just two minutes per day extra (+0.5 percent), this increase may not be particularly significant.
Despite these declines, however, there are still eight countries where the typical internet user spends more than half of their waking life online.
South Africa comes out top of the latest rankings, with the country’s “average” internet user saying that they spend more than 10 hours per day online.
Internet users in Brazil, the Philippines, Colombia, and Argentina all spend an average of more than 9 hours per day using the internet, while their peers in Malaysia, Thailand, and Mexico say that they spend more than 8 hours per day online.
At the other end of the spectrum, people in Japan remain significant outliers, with the country’s typical internet user saying that they now spend just 3¾ hours per day using connected devices and services.
Perhaps surprisingly though, China comes in second-to-last in GWI’s latest ranking, with the country’s working-age internet users spending an average of just 5 hours and 12 minutes per day online.
Evolving digital time: from quantity to quality
However, the overall decline in the time we spend online doesn’t necessarily mean that the internet is losing importance in our lives.
Even at the current average of 397 minutes per day, the typical global internet user still spends more than 40 percent of their waking life online.
Moreover, data suggest that most people outside of Western economies don’t use the internet all day at work.
For context, Gartner reports that there are now roughly 1 billion people engaged in the global “knowledge economy”, compared with a total global workforce of 3.3 billion people.
So, assuming that the average person works a 40-hour week and sleeps for between 7 and 8 hours per day, the latest numbers indicate that non-knowledge workers spend upwards of 60 percent of their free time using connected tech.
And once we allow time for things like eating, in-person socialising, and consuming “offline” media like broadcast TV and radio, it becomes clear that there’s not much room left for our online time to continue growing.
Reasons why online time may be falling
GWI’s research and analysis indicate that people are trying to become more “purposeful” in their use of the internet, especially after the rapid rise in time spent using social media during COVID-19 lockdowns.
As Tom Morris, Trends Manager at GWI, told us in a recent interview,
“We believe that the world has effectively reached a “saturation point” for time spent using the internet. In recent months, average daily time spent has actually decreased worldwide, across all generations, and even in internet growth markets like the Middle East and Latin America. We believe this is mostly the result of increasing mistrust in the news and rising social media-induced anxiety, especially as social media accounts for an increasingly prominent share of overall online time.”
It’s also interesting to note that – while people’s motivations for using the internet haven’t changed much since the pre-COVID era – the number of people who choose each option in GWI’s survey has declined across all options.
Once again, this change suggests that people may be more “selective” in how they spend their time online, hinting at a more considered and purposeful approach to using connected tech.
Implications
So what does all of this mean for marketers?
Well, the key takeaway here is that we also need to be more purposeful, ensuring that our marketing activities and content actively add value to our audiences’ online experiences.
In particular, marketers need to be particularly conscious of adding value when they use interruptive ad formats – especially when it comes the content we add to people’s social media feeds.
On the one hand, the latest data reveals that roughly half of all working-age internet users actively visit social platforms to learn about brands, and to research products and services that they’re considering buying.
However, with people becoming more thoughtful about where and how they spend their online time – especially in social media – it’s essential that brands don’t risk irritating their audiences with irrelevant content.
Furthermore, with many marketers facing budget cuts due to the challenging economic outlook, it’s never been more important for us to ensure that our investments in media and content deliver tangible value – both to audiences, and to the brand’s bottom line.
Meta revises its numbers… again
Meta appears to have made yet more revisions to its advertising audience figures.
The latest global reach numbers published in the company’s ad planning tools are significantly lower across all three of its advertising-focused platforms, even compared with the numbers that appeared in the same tools just 3 months ago:
Facebook: -4.1 percent vs. July 2022, equating to a drop of 89 million users
Instagram: -3.8 percent vs. July 2022, equating to a drop of 54 million users
Facebook Messenger: -2.4 percent vs. July 2022, equating to a drop of 24 million users
Combined reach across all platforms and the Audience Network: -5.5 percent vs. July 2022, equating to a drop of 161 million users
These revisions aren’t uncommon though – especially at this time of year – and we’ve seen the company make similar revisions to its reach numbers on numerous occasions over the past decade.
However, we’ve noticed that such revisions have become more frequent over recent months, and the company appears to have revised its figures for Instagram at least twice since the start of 2022.
Moreover, this is the first time that we’ve seen the company revise figures for all of its platforms at the same time.
Historically, we’ve avoided reporting figures for change over time when we’ve detected these kinds of revisions, because the subsequent change in published figures doesn’t necessarily correlate with an actual drop in “genuine” reach.
For example, these revisions may reflect a purge of duplicate and “fake” accounts, and as such, a drop in reported reach doesn’t necessarily mean that marketers can reach fewer ‘real’ people in their target audiences.
However, given the scale and frequency of recent revisions, we’ve decided to publish these change figures from hereon, in order to help marketers make better informed decisions.
This is partly because the potential global Facebook ad reach figure published in the company’s tools is now lower than the figure that the same tools reported this time four years ago.
In October 2018, Meta’s planning tools reported potential global Facebook ad reach of 2.091 billion, but the same metric stands at just 2.079 billion today.
The outlook for Facebook
However, it’s unlikely that recent changes in Meta’s reported ad reach will correlate with equivalent drops in monthly active users (MAUs).
The company did announce a drop in monthly active user figures in its Q2 earnings announcement, and Zuck and team may well announce a similar trend in the company’s next investor update.
But the decline in Facebook’s MAUs between April and June 2022 only amounted to 2 million users, which equated to a drop of just 0.1 percent of the global total – considerably less than the 4.1 percent decline in reported ad reach over the same period.
Based on the size of this difference, my assessment is that changes in reporting methodology are likely to be the main factor contributing to the recent drop in Meta’s reported ad reach, rather than a sudden drop in its active user numbers.
Guidance in the company’s ad planning tools reinforce this hypothesis, with a pop-up note next to reported ad reach figures now stating that this metric is “in development”:
“An in-development metric is a measurement that we’re still testing. We’re still working out the best way to measure something, and we may make adjustments until we get it right.”
The note goes on to clarify why existing metrics like ad reach might be re-classified as “in development”:
“We frequently launch new features and new ways of measuring how those features perform. Sometimes we publish these metrics even when the way we calculate them isn’t final to get more feedback, make them better and figure out the best way to measure performance.”
However, regardless of the cause, the latest figures are still considerably lower than the potential reach that Meta’s tools reported just a few months ago.
As a result, marketers should carefully review the latest ad reach numbers for their brands’ specific audiences, in order to understand and quantify what paid media activities might deliver.
It’s also important to highlight that the figures for potential ad reach published in Meta’s planning tools are largely influenced by the number of people who were shown ads on its various platforms over the preceding 30 days.
As a result, it’s worth considering that any drop in reported potential reach may also be influenced by the number of advertisers buying ads on Meta’s platforms, and also the scale of their media spend.
For example, a drop in the number of advertisers – or in the amount that those advertisers spend on each platform – might result in fewer users seeing ads on Meta’s platforms, which in turn might affect the potential reach figures that the company’s tools report.
However, the latest data from Skai suggests that marketers actually spent more on social media ads in Q3 2022 versus Q2.
Moreover, average social media CPMs (the cost to deliver 1,000 social media as impressions) actually fell over the past 3 months, so that increased investment resulted in an 18.8 percent increase in the number of social media ads that were shown to users across all social platforms.
As a result, if the decline in reported reach across Meta’s various platforms were to have been affected by the number of advertisers and size of their investments, this might point to a decline in Meta’s share of the overall social media advertising market.
So… is Facebook “dying”?
Spoiler alert: no.
Investors and marketers alike will want to keep a careful watch on how these numbers evolve, but it’s important to stress that Facebook is still far from “dead”.
For clarity, media hyperbole relating to a purported “imminent demise” of Facebook is nothing new, and a New York Times headline decried a “Facebook Exodus” way back in August 2009.
Since then – even after the recent dip in global MAUs – Facebook’s active user base has grown by a factor of more than 10.
Despite those impressive growth figures, however, barely a week goes by without another click-bait headline delivering a dubious reading of the data.
Sure, there’s plenty to keep the team at Mountain View awake at night, from declining use amongst teenagers in its most valuable market, to ongoing regulatory issues.
However, Facebook is still by far the world’s most used social media platform, and the available data suggest that it still has hundreds of millions more active users than its next nearest rival.
Meanwhile, Meta still accounts for all three of the world’s “favourite” social media platforms, and – crucially – people are still two-and-a-half times more likely to choose Facebook as their favourite social platform as they are to choose TikTok.
Moreover, analysis from data.ai reveals that the amount of time that the typical user spends using the Facebook app has actually increased over recent months, up from an average of 19.4 hours per month in Q1 2022, to an average of 19.7 hours per month in Q2.
Looking ahead
But what about the future?
Well, even if Meta were to announce further declines in active user numbers over the coming months, it would likely take many years – and perhaps even decades – before Facebook actually “dies”.
For context, data from Semrush reveals that well over half a billion people still visit Yahoo! each month, despite the platform all but disappearing from media headlines over recent years.
Based on these Yahoo! trends, we can expect Facebook to continue attracting an audience of billions for the foreseeable future.
And as a result, you can rest assured that Facebook will continue to offer valuable marketing opportunities well beyond the horizon of even your most forward-looking media plan.
And if you’re still not convinced about that, take a look at these latest figures from Statcounter, which show that Facebook is still responsible for more than 70 percent of all web traffic referrals that originate from social media.
Building better-informed plans
But while we’re on the subject of how headlines can distort our perspective, let’s compare Facebook’s latest numbers with some other platforms that seem to be current media darlings.
To be clear, I’m not advocating for Facebook here; I simply want to provide some objective perspective.
Firstly, numbers reported in each company’s ad planning tools indicate that marketers can still reach twice as many adults aged 18 and above with ads on Facebook as they can with ads on TikTok.
Sure, the figures for teens might look a bit different, but Bytedance’s tools don’t report data for users below the age of 18, so it’s difficult to know for sure.
Moreover, if you’re not actively targeting teenagers, trends amongst younger users offer little more than trivia, and – as a marketer – you’d do better to focus your attention on what your specific audiences are actually doing today.
Next up, BeReal.
Yes, the platform is generating lots of buzz, and yes, the platform appears to be growing quickly.
Indeed, data from Sensor Tower reveals that – since launching just 2 years ago – the app has been installed on a cumulative total of 53 million smartphones.
However, it’s important to stress that this figure doesn’t equate to active users, and figures from August 2022 suggest that the app currently sees just 10 million daily active users.
And even if that number were to have doubled since August, Facebook would still reach roughly 100 times as many daily active users as BeReal.
None of this is to say that BeReal and TikTok are bad choices of course; nor am I saying that you should necessarily prioritise Facebook.
I’d simply like to add a dose of realism to your 2023 planning.
As a gentle reminder, our job as marketers is to build brands and drive sales – it’s not to jump on all the latest bandwagons.
Sure, if you can see a clear way to deliver efficient and effective outcomes via the hottest new platform, by all means go for it.
But don’t expect magic from a platform simply because it’s making headlines.
Critically, if you haven’t already made that “magic” happen on Instagram or TikTok, there’s no reason to expect that you’ll fare any better on BeReal – or on the next hot platform that will surely come along behind it.
And that’s because the users of any given social platform are largely the same, even if each platform offers a slightly different demographic profile, and slightly different opportunities to engage people.
For context, 95 percent of working-age internet users say that they use messaging apps and social networks each month, so it’s highly unlikely that you’ll be able to reach any “unique” users on a new social platform.
Indeed, as the excellent data from GWI in the chart below shows, even the largest and most established platforms can barely claim 1 percent unique reach, while fewer than 1 in every thousand users on newer platforms like TikTok can be considered unique.
So, given that marketers everywhere will be under increased scrutiny over the coming months as fiscal belts tighten, my advice would be not to abandon tried and true favourites like Facebook in favour of “shiny new objects”.
Making sense of Metaverse numbers
But the impact of click-bait isn’t restricted to social media.
Another headline that’s been doing the rounds in recent weeks relates to the growth of the Metaverse – or rather, a purported lack of growth.
A widely shared article published by CoinDesk reported that virtual world Decentraland has just 38 active users, despite attracting a market valuation in excess of USD $1 billion.
And no, that wasn’t a typo – the quoted active user number was indeed just 38.
However, the same article goes on to concede that this figure – which CoinDesk sourced from DappRadar – only represents the number of “unique wallet addresses” that interacted with a Decentraland smart contract.
In other words, the figure only includes those users who made an active purchase within the Decentraland environment, and it completely ignored anyone who logged in without making a purchase.
This is clearly a highly “selective” use of data though, especially because such a tight definition misses out on various popular activities like virtual concerts and fashion shows.
For example, Nielsen (via Statista) reports that more than 12 million users attended Travis Scott’s Astronomical event in Fortnite in 2020.
So, perhaps unsurprisingly, Decentraland reacted quite strongly to CoinDesk’s claims, describing the user metrics cited in the article as “inaccurate”.
However, in the response it published to its own blog, Decantraland also revealed that it currently has fewer than 57,000 monthly active users.
That’s certainly many more than 38, but – with a reported valuation of more than a billion dollars – that would value each MAU at more than $17,500 each.
Of course, investors will likely expect the active user figure to increase over time, but the same blog post also reveals that Decantraland’s monthly active users have actually declined since “the early metaverse hype of late 2021”.
So, are the naysayers right – is “the Metaverse” really just a lot of hot air?
Well, other data suggests not.
Sure, the user figures for Decentraland and the Sandbox don’t offer much to get excited about (yet), but similar figures for other “virtual worlds” look a lot more promising.
Part of this comes down to definitions of course, and each person’s perspective may vary depending on how they think of the “Metaverse”.
For example, if you’re willing to include immersive games that feature in-world experiences in your Metaverse definition, there are already plenty of impressive numbers to explore.
For starters, analysis from ActivePlayer.io suggests that Fortnite, Roblox, and Minecraft – all of which might qualify as Metaverse-like “virtual worlds” – already attract hundreds of millions of monthly active users (MAUs):
Fortnite: 254 million MAUs in September 2022, with a peak of 30 million per day
Roblox: 204 million MAUs in September 2022, with a peak of 20 million per day
Minecraft: 173 million MAUs in September 2022, with a peak of 17 million per day
So, despite sensational headlines offering highly selective readings of the data – albeit in both directions – there’s also plenty of tangible evidence to suggest that the Metaverse does indeed have potential.
However, whether that potential extends beyond the current gaming focus, and exactly how much that potential is worth, remains to be seen.
For example, it looks like Zuck and team may have missed the mark when it comes to Meta’s first forays into the Metaverse.
One year after its much vaunted launch, Horizon Worlds currently attracts fewer than 200,000 monthly active users – that’s more than a thousand times fewer than Roblox or Fortnite.
Meanwhile, a recent report in the WSJ cited internal Meta documents which indicate that fewer than 10 percent of “worlds” built by creators within Horizon have had more than 50 visitors, while “most are never visited at all”.
Based on the above, it seems Metaverse marketing opportunities are still limited to brands who sell items like NFTs within virtual gaming worlds, or to brands who can turn their virtual-world exploits into real-world PR.
So, while we’ll certainly keep tracking the popularity of virtual worlds, if you can’t already see an obvious way to tap into these environments, I’d suggest that your marketing dollars are probably better spent elsewhere – at least for the time being.
So, let’s return our attention to the “real” world…
YouTube tops time spent
As you may have noticed in one of the charts we featured above, YouTube has reclaimed top spot in data.ai’s latest ranking of social media apps by average time spent.
The typical user spent an average of 23.4 hours each month using YouTube’s app between 01 April and 30 June 2022, equating to almost one-and-a-half days of total waking time.
TikTok slipped back to second place in the Q2 ranking, with users outside of mainland China spending an average of 22.9 hours per month using the short-video platform in the second quarter of 2022.
As we noted above though, data.ai’s numbers have better news for Facebook, which saw its average monthly time per user increase to 19.7 hours per month in Q2, compared with 19.4 hours per month in the first three months of 2022.
Updating our TikTok numbers
Due to quirks in the way that Bytedance’s tools report potential advertising reach for its various services, we’ve revised our ad reach numbers for TikTok in our October 2022 report.
However, it’s important to stress that these numbers don’t represent a decline in TikTok use compared with previous quarters.
Rather, the difference in our reported numbers results from a change in the source data that we use to calculate the numbers that we report.
Based on these revisions, our latest analysis indicates that TikTok ads now reach 945 million adults over the age of 18 each month, which is 121 million more than they reached just 12 months ago.
TikTok’s ad reach has grown by 14.6 percent over the past year, and the platform’s ads now reach more than 1 in 6 adults on Earth every month.
TikTok’s revenues continue to grow
And it’s not just TikTok’s ad reach that’s growing, either; users continue to spend more and more money on the platform too.
Analysis from Sensor Tower reveals that TikTok’s worldwide revenues – which include spend on Douyin in China – reached more than USD $914 million between July and September 2022, taking its cumulative, lifetime total to roughly USD $6.3 billion [note that we separate user figures for TikTok and Douyin elsewhere in our reports].
And what’s more, this revenue figure only includes consumer spend on TikTok – which comes largely via the purchase of TikTok Coins – and doesn’t include the revenues that Bytedance earns from advertising.
Both data.ai and Sensor Tower report that TikTok was the world’s top grossing non-game mobile app in Q3 2022, as ranked by combined consumer spend across the Google Play and Apple iOS stores.
The state of the app economy
Looking at the broader app market, data.ai reports that smartphone users spent a total of $32.4 billion on mobile apps over the past three months, although that figure is $1.6 billion lower than the figure that the company reported for the same period last year.
Separately, Ericsson reports that there are more than 6.6 billion smartphone handsets in use around the world today, which means that the average smartphone user spent about $4.86 on apps and in-app purchases between July and September this year.
Sensor Tower reports a similar quarter-on-quarter decline in app spend of USD $1.6 billion, but the company offers a slightly lower figure for overall consumer spend in Q3 2022 versus data.ai’s figure, at USD $31.6 billion
However, Sensor Tower’s analysis also reveals that the vast majority of consumer spend goes to just a tiny fraction of app publishers.
Indeed, more than 90 percent of consumer spend on mobile apps goes to just 1,800 publishers, who account for less than 1 percent of the 185,000 developers across the Google Play and Apple iOS stores.
Smartphone OS competition evaporates
But smartphone imbalances aren’t limited to app publishers.
The latest data from Statcounter shows that Alphabet and Apple have almost no competition when it comes to smartphone operating systems.
The latest figures reveal that Android and iOS accounted for more than 99 percent of the smartphone handsets that accessed content on the web in September 2022.
The same data shows that Samsung OS now ranks third at a global level, but with just 0.38 percent share of the global market, it seems that all other contenders are fighting a losing battle [note that most Samsung smartphones now run the Android operating system].
Furthermore, Statcounter’s data reveals that Google and Apple continue to consolidate their dominance, with the combined share of all other platforms dropping from 0.81 percent this time last year, to just 0.65 percent in September 2022.
Relatively, that means that those other platforms collectively lost roughly 20 percent of their combined share over the past year.
Reels keep rolling
The number of users that marketers can reach with ads in Meta’s Reels feeds continues to grow.
Figures published in the company’s ad planning tools reveal that the global audience for ads in Facebook Reels has jumped by almost 50 percent over the past three months.
The latest potential reach figure is just a shade below 700 million users, reflecting an increase of more than 220 million users since July 2022.
The number of users seeing ads in Instagram’s Reels feed has also increased since last quarter, albeit at a much more modest rate.
Figures for October 2022 show that Instagram Reels ads now reach 758.5 million users, which is 0.5 percent more than the 754.8 million users that Meta’s ad planning tools reported back in July.
Crypto adoption increases despite collapse in value
Research from GWI shows that first-time buyers continued to enter the crypto markets between April and June 2022, despite the valuations of popular currencies like Bitcoin and Ethereum dropping significantly during this period.
GWI reports that the number of working-age internet users who say that they own at least one form of cryptocurrency grew from 12.1 percent in Q1 of this year, to 12.3 percent in Q2.
That may sound like a fairly modest increase, but these figures translate to a 1.7 percent increase in the number of people who own cryptocurrencies.
And when we consider that the Bitcoin-USD exchange rate fell by almost 60 percent during the first six months of 2022, that growth looks much more impressive.
However, with cryptocurrency valuations continuing to decline through much of Q3 2022, and with their valuations continuing to fluctuate wildly from day to day at the start of Q4, it will be interesting to see whether crypto ownership continues to grow over the next few waves of GWI’s research.
And if you’d like to dig deeper into this story, check out our 2023 outlook briefing video at the end of this article.
The social web
While it’s no secret that TikTok has been adding millions of users over recent months, the platform has seen impressive growth in another metric that may come as more of a surprise.
Both Semrush and Similarweb report that TikTok.com has now entered the top 20 most-visited websites in the world.
In other words, TikTok isn’t just one of the world’s biggest mobile apps; it’s also one of the hottest properties on the web.
To put this in perspective, Semrush reports that TikTok.com now attracts more than 800 million unique visitors per month, which may equate to more than half of the platform’s total active user base.
Meanwhile, data from Google Trends also reveals that searches for “TikTok” have increased steadily over recent months.
Across all queries entered into Google around the world between 01 July and 20 September 2022, TikTok ranked 25th by total search volume.
And given similar trends for Facebook, Instagram, and WhatsApp Web, there’s a good chance that many of these searches were conducted by people hoping to consume TikTok content from within a web browser, as opposed to people simply looking to learn what TikTok is, or to download the app.
As an aside, it’s also interesting to note that “TikTok” currently ranks 16th in the world’s top queries on YouTube.
There’s a certain irony to these search trends though, considering that Google execs are increasingly worried about the number of people who’ve moved their search activity from search engines to social platforms.
There’s little data to tell us whether TikTok’s web users are any different to the users of its mobile app, but – even if users were to be the same – the usage context in a web browser will likely be quite different to the one in the platform’s app.
Having said that, the TikTok experience is no less compelling in a web browser, with visitors landing directly in a “for you” feed without needing to create an account or log in (try it for yourself here).
It’s unclear whether this rise of TikTok activity in web browsers has any distinct implications for marketers, but nonetheless, it’s worth considering if you’re planning TikTok content.
Beyond apps
But it’s important to note that this “social web” phenomenon isn’t unique to TikTok.
Semrush’s latest data reveals that the websites of most of the top social platforms continue to attract billions of unique visitors each month, although it’s worth noting that – due to people’s use of multiple connected devices – these figures may include a meaningful degree of duplication when it comes to unique individuals.
YouTube sees the highest number of unique visitors to its website, with Semrush reporting that a whopping 5 billion unique devices visited YouTube.com in August 2022.
Meanwhile, despite the company’s own data suggesting that app usage dominates Facebook access, more than 2 billion unique devices also visited Facebook.com in August.
The websites of Twitter and Instagram continue to attract well over a billion unique visitors each month too.
And the number for Twitter is particularly interesting, because it suggests that a significant number of people continue to use the platform without logging in – and perhaps without even creating an account.
Similarly, despite the platform reporting unique daily users of just 50 million, Reddit’s website also attracts more than 1 billion unique visitors each month, suggesting that many of the platform’s visitors don’t register or log in.
And while it sits just outside of Semrush’s current top 20, Similarweb reports that WhatsApp.com is also a favourite on the web, attracting more unique visitors than many of the world’s top adult sites.
TVs are increasingly connected
Returning to the devices that people use to access connected content, it’s interesting to see that nearly a third of working age internet users now connect their TVs to the internet.
The latest data from GWI reveals that 31.1 percent of global internet users aged 16 to 64 now use a television set to access connected services and content.
This figure has increased by a relative 4 percent (+120 basis points) over the past year, and shows that audiences are increasingly blurring the “lines” that marketers still cling to.
So, one of the key takeaways here is that – when it comes to media plans – it might make sense to forget about lines completely, whether it’s “online vs. offline”, or “above the line vs. below the line”.
Ultimately, all that matters is connecting with our audiences in the most relevant times and places, and trends in how people use devices and media suggest that traditional media “buckets” may be leading to poorer choices.
Computers still trump mobile in developed economies
The latest data from GWI reveals that mobile accounts for an ever greater share of our online activity, accounting for 55.7% of the world’s total internet time in Q2 2022.
Perhaps surprisingly though, the same dataset also reveals that computers still dominate in most Western countries, and users in the United States, Canada, and all European countries except Romania still spend more time online via laptops and desktops than they do via mobiles.
Belgians have the strongest preference for using computers to access the internet, with the country’s netizens spending close to 60 percent of their online time using these devices.
At the other end of the spectrum, internet users in Asian and Middle Eastern countries are more likely to use mobile devices.
GWI’s data shows that the typical internet user in Thailand, Indonesia, and India uses a mobile phone for more than 60 percent of their overall internet activity, with China just below that figure at 59.9 percent.
However, with 92 percent of global internet users going online via a mobile phone compared with 66 percent using a computer, it’s clear that mobile phones are still the world’s “most used” internet devices.
Moreover, there are important differences across age groups, and young people are considerably more likely to use mobile phones for their online activities compared with older generations.
For example, internet users aged 16 to 24 spend 59.5 percent of their online time using a mobile, whereas that figure falls to 47.2 percent amongst users aged 55 to 64.
Furthermore, despite the continued preference for computers across Western markets, the number of people at a worldwide level who say that they use a laptop or desktop computer to access the internet has fallen significantly over recent months.
GWI’s latest data reveal that 9 percent fewer people use computers to access connected content and services today compared with this time last year.
Moreover, that number has fallen from more than three-quarters of all internet users in 2019, to less than two-thirds in 2022.
It’s also interesting to note that the number of people who say that they own a laptop or desktop has declined meaningfully over the past year, with data from GWI suggesting that 8.5 percent fewer people own a computer today than did so this time last year.
Fewer than 6 in 10 working-age internet users now report owning a computer of their own, which is down from more than 7 in 10 this time 3 years ago – and that’s despite a big jump in computer sales during the initial wave of COVID-19 lockdowns.
For reference, this downward trend in personal computer ownership suggests that many of those COVID-related sales may have been driven by employers providing computers for their staff to work from home.
Mobile data traffic passes new milestone
And as mobiles account for an ever greater share of our internet activities, so the amount of data that we consume via cellular networks continues to grow.
The latest data from Ericsson shows that mobile data traffic now exceeds 100 exabytes per month, or more than 100 billion gigabytes.
For context, that equates to roughly 33 billion hours of streaming video at 1080p resolution.
At a worldwide level, Ericsson reports that the ‘typical’ smartphone user now consumes more than 15GB of cellular data per month – and that doesn’t include the data that they consume over wifi.
However, Ericsson also reports significant differences by geography.
At the top end of the spectrum, users in countries that comprise the Gulf Cooperation Council (GCC) consume an average of 25GB per month, per user, while users in India consume in excess of 20GB each.
Meanwhile, sub-Saharan Africa sees the lowest levels of cellular data traffic, with the typical user across the region consuming an average of just 3.67GB per month.
Even that figure has grown rapidly in recent years though, with Ericsson’s data revealing that the typical sub-Saharan smartphone user now consumes 4.4 times as much data each month as they did this time 5 years ago.
5G has played an important role in fuelling the growth of mobile data consumption around the world, with faster connection speeds resulting in improved access to higher-bandwidth content.
Indeed, the latest Speedtest insights from Ookla show that the median mobile connection is now 25 percent faster than it was this time last year.
Median mobile connection speeds now exceed 100Mbps in 6 countries around the world, with Norway topping the latest rankings at close to 123Mbps.
However, it’s interesting to note that median speeds now exceed 90Mbps across all countries in the GCC except for Bahrain, where the median connection is “only” 76Mbps.
That’s still two-and-a-half times faster than the global average of 30Mbps though, so it’s perhaps no surprise that the region sees the highest levels of data consumption in the world.
Podcasts capturing more of our time
The latest data from GWI reveals that the typical working-age internet user now spends more than an hour per day listening to podcasts.
At a worldwide level, the average daily time spent listening to podcasts has increased by 7 percent over the past year, equating to an additional 4 minutes per day.
21.3 percent of internet users aged 16 to 64 now listen to podcasts each week, for an average of 61 minutes per day.
For perspective, these figures suggest that working-age adults in the 48 countries covered by GWI’s survey will spend a combined total of more than 24 million years listening to podcasts in 2023.
It’s interesting to note that the popularity of podcasts varies significantly by culture, although there’s no obvious pattern connecting countries where podcasts are either more or less popular.
Brazilians are the biggest consumers of podcast content, with more than 4 in 10 working-age internet users in the country saying that they listen to at least one podcast each week.
At the other end of the spectrum, Japanese people are the least likely to consume podcasts, with fewer than 1 in 20 working-age internet users in the country saying that they’ve listened to a podcast in the past seven days.
Younger age groups are more likely to listen to podcasts than their parents’ generation, although Millennials are ahead of Gen Z when it comes to the share of internet users who tune in to podcasts each week.
It’s also interesting to note that women are more likely to say that they listen to podcasts compared with men, which may go against the stereotype of the “typical” podcast listener.
Shein shines
Online fast fashion sensation Shein continues its impressive ascent, with Sensor Tower reporting that the retailer enjoyed more US downloads of its app than Amazon did in the second quarter of 2022.
Sensor Tower’s data indicates that Shein saw roughly 6.8 million downloads of its app in the United States between April and June this year, compared with 6.3 million downloads of the Amazon app during the same period.
Meanwhile, despite its category focus, data.ai reports that Shein is now the ninth most-used shopping app in the world, and is the only dedicated fashion retailer to make the top 10.
Amazon topped data.ai’s global rankings for Q3 2022 based on the number of active app users, while Singapore-based Shopee ranked second.
India’s Flipkart came in third, while another Singapore-based retailer – Lazada – ranked fourth, and China’s AliExpress rounded out the top 5.
For comparison, data.ai ranked eBay in eighth place at a global level, while Walmart’s app ranked 17th.
More broadly, shopping apps place fourth in GWI’s latest ranking of the types of websites and mobile apps that people use each month.
Almost 56 percent of the world’s working-age internet users say that they’ve used an online shopping, auction, or classified platform in the past 30 days, putting shopping ahead of email, music, and even news and weather services.
Barely 1 in 3 decline cookies
If you’ve spent any time reading about online privacy, you might be surprised to learn that the majority of internet users still accept cookies.
At a global level, GWI finds that barely 37 percent of working-age internet users decline cookies at least some of the time.
Austrians and Germans are the most likely to decline cookies, with more than half of internet users between the ages of 16 and 64 saying that they take active steps to reject the internet trackers.
At the other end of the spectrum, fewer than 1 in 5 people in Japan and South Korea say that they decline cookies at least some of the time.
Interestingly, however, attitudes towards cookies remain relatively consistent across age groups and genders, with younger users only slightly more likely to reject cookies than their parents’ generation.
Women are slightly less likely to reject cookies too, although the differences between men and women are minimal.
So what do these numbers tell us?
Well, despite collective hand-wringing by regulators in Europe, and ongoing industry debates around the legitimacy of cookies, it seems that most internet users don’t actually care.
Indeed, the data shows that – even when given the choice – fewer than 4 in 10 of us take active steps to protect our privacy against these online trackers, suggesting that most people simply click “accept all”, and move on.
That’s not to say that digital platforms and marketers shouldn’t be doing more to protect people’s privacy of course, but this data does suggest that regulators and the media may be making a bigger deal out of cookies than public opinion might warrant.
And there’s more data to support this hypothesis in GWI’s research too, with fewer than 1 in 3 working-age internet users saying that they worry about how companies might use their personal data online.
Future trends
We’re now just a few weeks away from the end of the year, so to finish up this quarter’s analysis, let’s turn our attention to what the year ahead may hold for the world of digital.
And the good news is that we’ve produced a complete video briefing for our 2023 outlook, which explores 12 themes that we believe will shape and define marketing success in 2023 and beyond.
You can watch our complete briefing presentation in the YouTube embed below, but if you’d prefer to read a transcript of that video – or if you’d like to access the complete set of slides that I use in this presentation – simply click here.
Note: due to the time required to produce this briefing, many of the charts included in the presentation feature data from our Digital 2022 July Global Statshot report. Some of these figures may differ from those in our newer Digital 2022 October Global Statshot Report, but the good news is that you’ll find that complete new report at the top of this article.
Wrapping up
That concludes my analysis for our October Global Statshot Report, and for our Digital 2022 series as a whole.
However, you may be pleased to hear that we’re already hard at work on production of our Digital 2023 reports, which we’ll start to publish in January.
You can expect our flagship Digital 2023 Global Overview Report to launch in the last week of January, while the first of our local country reports will appear in mid-February.
In the meantime, if you’re looking for more stats, I’d recommend the following resources:
Our Digital 2022 Global Overview Report (click here)
Our latest reports on the world’s top social media platforms (click here)
Our complete library of free reports, with data covering more than a decade of digital behaviours across 240 countries and territories (click here)
That’s all for now though; I hope you have a good end to 2022, and I wish you the very best of success for 2023.
Click here to see all of Simon’s articles, read his bio, and connect with him on social media.