
Digital 2022: Time Spent Using Connected Tech Continues to Rise
One of the top stories at the start of the COVID-19 pandemic was how much more people came to rely on internet-connected technologies and services, especially as many countries entered lockdown.
However, despite fluctuations in movement restrictions over the past two years, data in our Digital 2022 Global Overview Report reveals that people are in fact spending more time than ever using connected tech in 2022.
Internet time
Research from GWI reveals that the “typical” global internet user now spends almost 7 hours per day – 6 hours and 58 minutes to be precise – using the internet across all devices.
For context, if we assume that the average person spends roughly 7 to 8 hours per day sleeping, the typical internet user now spends more than 40 percent of their waking life online.
The amount of time we spend online continues to climb too, with the daily average increasing by 4 minutes per day (+1.0 percent) over the past year.
That may not sound like a big increase, but added up across all of the world’s internet users, those 4 extra minutes per day should equate to more than 5 billion additional days of internet use in 2022.
In total, the latest numbers suggest that the world should spend more than 12½ trillion hours online in 2022 alone.
As with most data points in our Global Digital Reports, however, there are considerable differences in behaviour by geography.
South Africans now spend the greatest amount of time online each day, with the country’s working-age internet users saying that they spend an average of 10 hours and 46 minutes on connected activities every day.
Again allowing 7 to 8 hours per day for sleep, that means that the typical South African internet user now spends roughly two-thirds of their waking lives online. And remember, that’s just the average user; many people will spend even longer online.
Filipinos, Brazilians, and Colombians aren’t far behind South Africans, with the average internet user in those countries now spending more than 10 hours per day online.
At the other end of the scale, Japanese users report spending the least amount of time online each day, with the national average below 4½ hours per day.
It’s also interesting to note that China sits quite far down these rankings, with the country’s internet users saying they “only” spend an average of 5 hours and 15 minutes per day online.
Television time
While it’s unlikely that people’s daily media time is a “zero sum game”, it is interesting to note that the four-minute increase in global daily internet time over the past year is in direct contrast to the four-minute decline in daily TV viewing time.
However, despite that dip in TV’s overall share of our daily media activities, it’s worth highlighting that “over-the-top” video services – which include internet-powered streaming services like Netflix – account for an ever greater share of our TV viewing time.
The latest numbers from GWI show that internet users spent 44 percent of their total TV time watching streaming services in Q3 2021, with that share figure increasing by a relative 4.4 percent – or 180 basis points if you’d prefer absolute share growth – compared with this time last year.
On average, global internet users aged 16 to 64 spend roughly 1½ hours per day watching streaming content, compared with 1 hour and 50 minutes for ‘linear’ TV (e.g. broadcast and cable).
For context, the average time that internet users spend watching streaming TV increased by 2 minutes per day over the past year, while the time we spend watching broadcast TV decreased by an average of 6 minutes per day.
It’s also worth highlighting that the number of working-age internet users who say they own a TV streaming device such as an Apple TV or a Chromecast has increased by 7.6 percent over the past year.
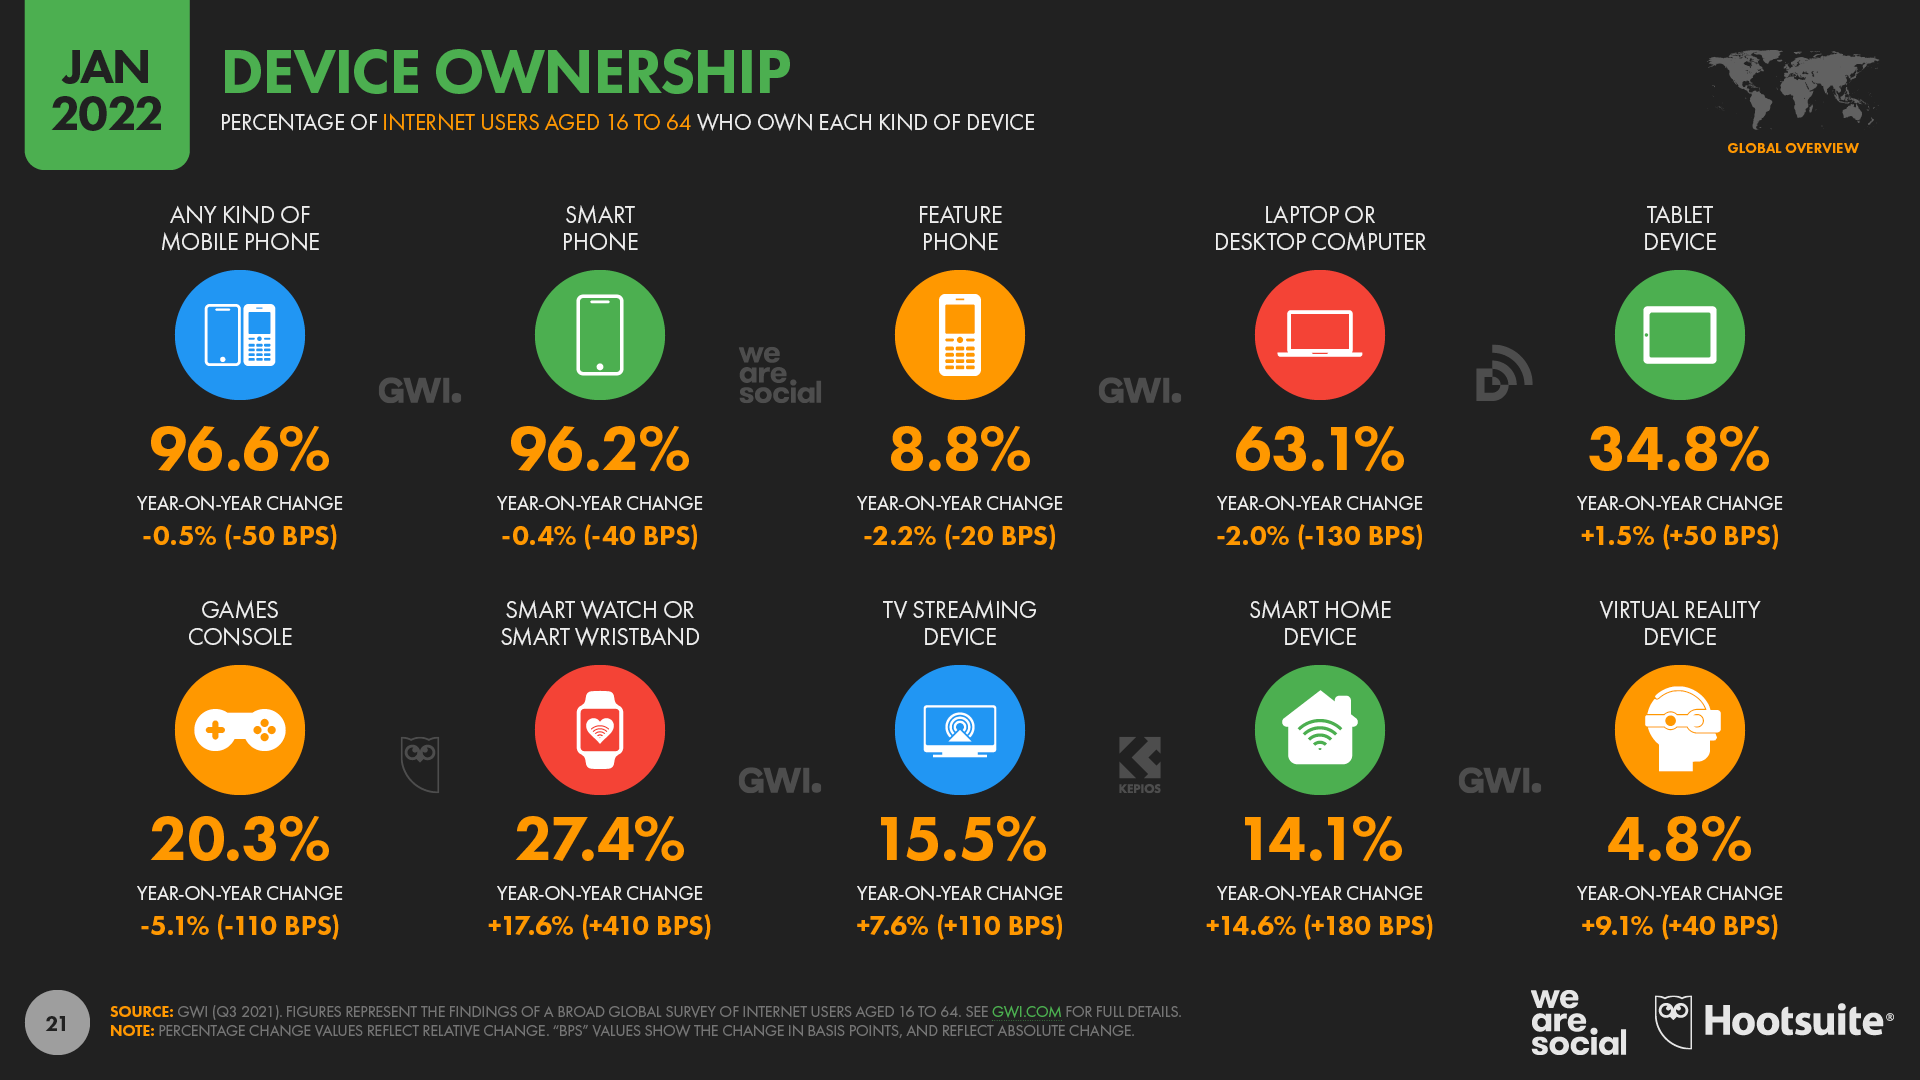
Ownership of Internet Connected Devices January 2022 DataReportal
Social media time
At an average of 2 hours and 27 minutes per day, social media accounts for the largest single share of our connected media time, at 35 percent of the total.
The time we spend using social media has grown again over the past year too, up by 2 minutes per day (+1.4 percent).
However, social media’s share of overall internet time has actually fallen slightly since the start of the COVID-19 pandemic.
This is largely because people have embraced a variety of new online activities over the past two years, so – relatively – social media now accounts for a smaller share of total online time than it did when people did fewer things online.
Mobile’s share of connected time
It’s also interesting to note that mobile’s share of our daily connected time continues to grow.
Mobile phones now account for 53.5 percent of the time that working-age internet users spend online, up by 1.3 percent (+70 basis points) compared with this time last year.
Similarly, data from Statcounter shows that mobile’s share of web traffic has risen again over the past year.
Web browsers running on mobile phones accounted for an average of 54.4 percent of web page requests across the final three months of 2021, representing a 3.8 percent increase compared with the final quarter of 2020.

Mobile's Share of Global Web Traffic Over Time January 2022 DataReportal
However, it’s worth highlighting that web-based activity only accounts for a small fraction of the time that the world’s smartphone users spend interacting with their devices.
The latest data from App Annie reveals that the time spent using mobile browsers only represented 7.5 percent of total mobile time in 2021, with native mobile apps accounting for the vast majority of the world’s mobile activity.
For context, that means web browsing accounts for just 1 in every 13 minutes that we spend using our smartphones.
Computers’ share of internet time
Laptop and desktop computers are still a crucial part of the mix though, so marketers should be careful not to interpret “mobile first” as meaning “mobile only”.
On average, 92 percent of global internet users aged 16 to 64 go online via a mobile phone, but more than 70 percent still use computers.
As you can see from those figures, the majority of internet users still use both mobiles and computers for at least some of their connected activities, although it’s likely that each individual will have their own device preferences when it comes to specific activities.
Device use varies considerably by geography too, with nearly 9 in 10 internet users in Poland going online via a laptop or desktop computer, compared with fewer than 1 in 4 in Ghana.
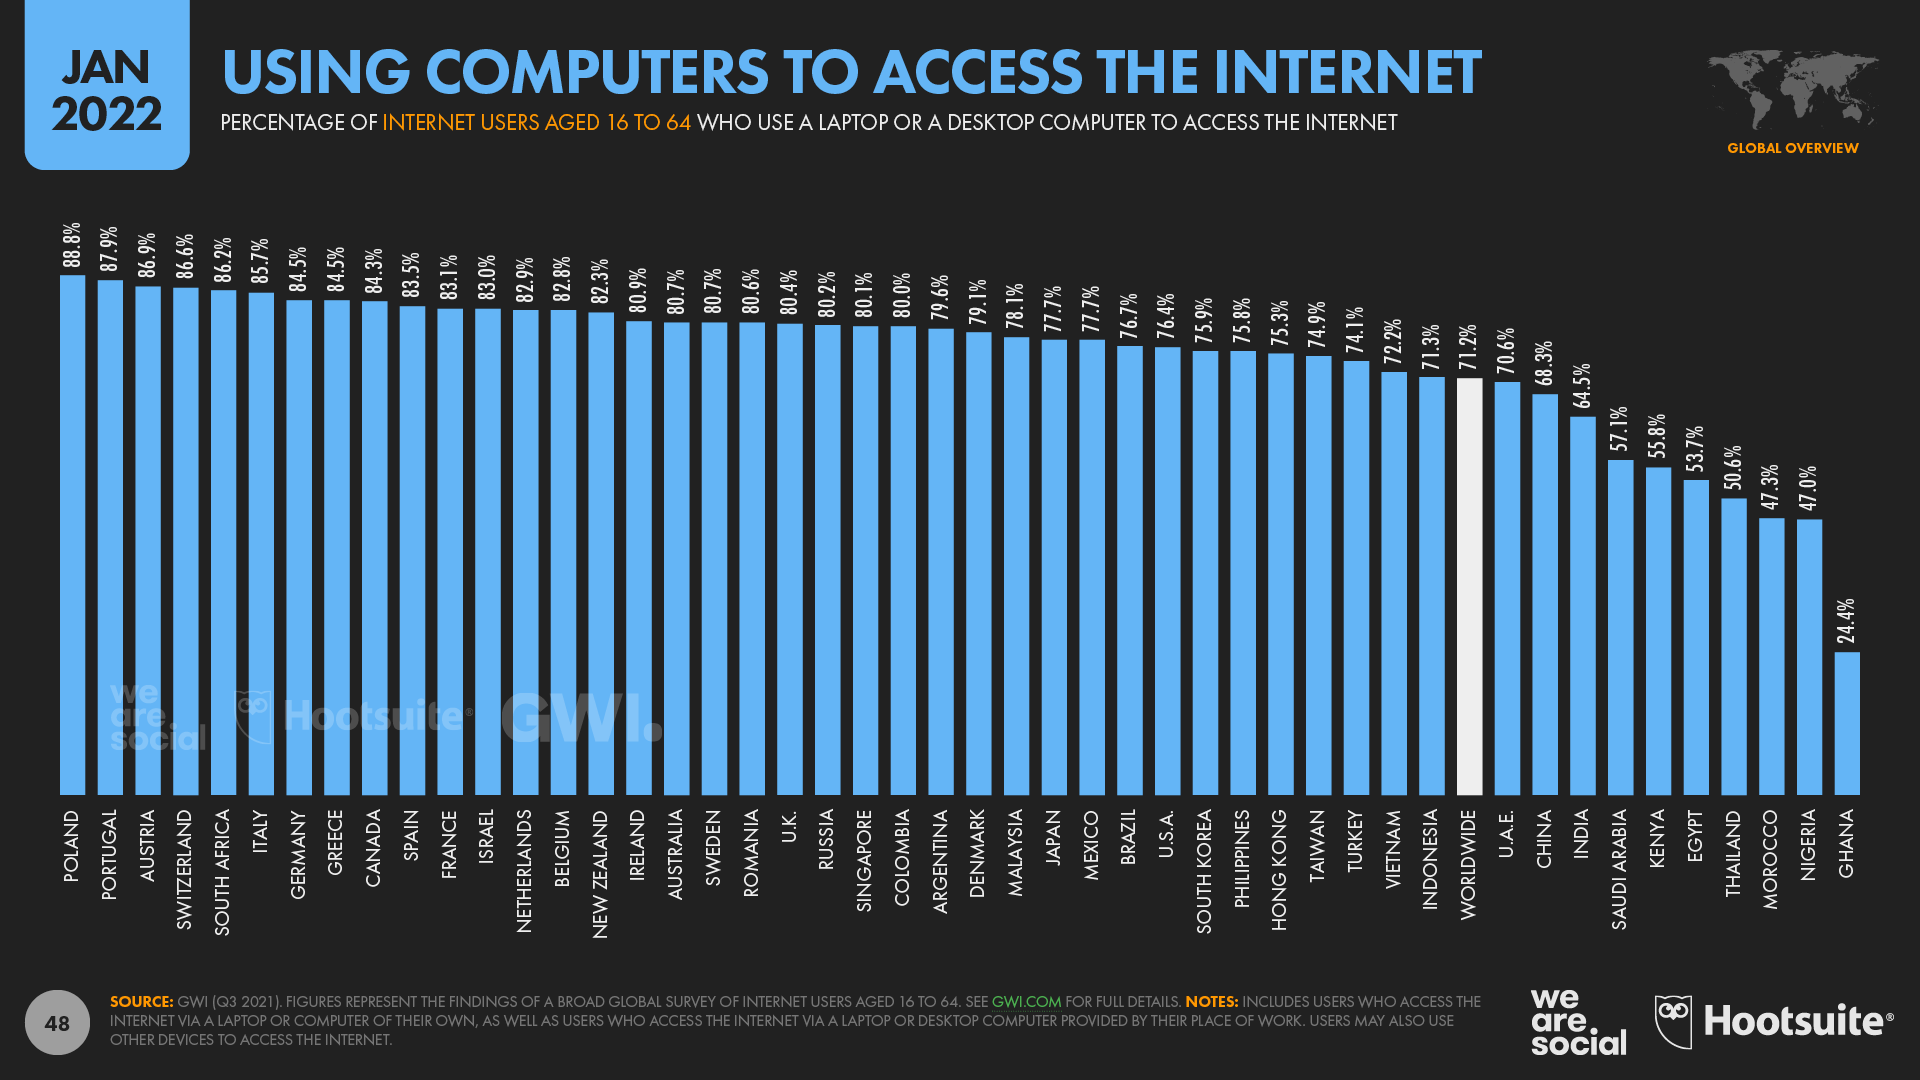
Use of Computers to Access the Internet by Country January 2022 DataReportal
So, while mobile should be a central pillar of most marketing plans, it’s also important to consider which activities our audiences will be engaging in when we hope to reach them.
For example, data from Meta’s self-service advertising tools reveal that a whopping 98.5 percent of Facebook’s active user base uses a mobile phone to access the service, and more than 80 percent only using mobile phones to browse their Facebook feeds.

Facebook Access by Device January 2022 DataReportal
It’s likely that computers will still be the preferred device for a number of online activities though, especially when it comes to internet use at work.
Device preferences also vary by age and gender, albeit not as much as they used to.
Overall, internet users aged 55 to 64 are less likely to use a mobile phone to go online compared with internet users aged 16 to 24.
Conversely, these older users are more likely than younger users to access the internet via a laptop or desktop computer.
However, nearly 90 percent of “older” users still go online via a mobile phone, while 2 in 3 Gen Z internet users still go online via computers.
So the best approach is to cater to both eventualities.
I’d definitely recommend investing time to think about which device will provide the best user experience for the content you want to share, and examine your web analytics to see how users access your current content.
Remember that it’s your audience who will make the ultimate decision as to which device they want to use though, so in almost all cases, it makes sense to cater to mobiles and computers.
Want to learn more about the state of digital in 2022? Check out our full Digital 2022 Global Overview Report by clicking here.
Click here to see all of Simon’s articles, read his bio, and connect with him on social media.