
Digital 2025 July Global Statshot Report
If you’re looking for all the latest digital trends, I have good news: our Digital 2025 July Global Statshot Report has everything you need.
Published in partnership between We Are Social and Meltwater, this latest update in our ongoing Global Digital Reports series has all the data you need to understand evolving digital preferences and behaviours, including rich insights into:
Internet access
Mobile adoption
AI use
Social media preferences
Ecommerce activity
Engagement with digital marketing
Top stories
Things to look out for in this quarter’s report include:
The world’s most used AI platforms
A deep dive into the disruption of search
Online video surpasses TV
The rise and rise of ChatGPT
The world’s “top” social media platform
How people feel about AI
A new milestone for connected TV
A big new milestone for internet connection speeds
A resurgence in online grocery shopping
The battle for the browser
…but that’s just a fraction of what you’ll find in the 540+ pages of the full report, so be sure to read on below to get the full story.
The ultimate collection of digital data
As always, we’d like to start by extending our heartfelt thanks to our generous data partners, who provide the world leading data you’ll find in this report:
Authenticity statement
All of this analysis has been written by Simon Kemp, without the use of generative AI [why does this matter?].
Simon has been producing the Global Digital Reports series for 15 years, so he’s intimately familiar with the global “state of digital”, and how people’s online behaviours are evolving.
If you’d like to follow Simon’s regular analysis, you can connect with him on LinkedIn.
⚠️ Important notes
As you explore this latest report – and especially as you compare trends in the data over time – please be aware of the following notes:
With the generous support of GWI, we’re delighted to bring you expanded insights into the use of the world’s top social media platforms in this quarter’s report. These charts provide valuable new perspectives on social media use, and enable readers to develop an even more detailed understanding of digital preferences and behaviours. Please pay careful attention to the descriptions on each chart to understand what it portrays, and be sure to check the footnotes to identify the relevant data source(s).
GWI has expanded its coverage of audiences aged 65+ to a range of new countries, which may impact various metrics across its research. Please keep this expansion in mind when comparing the latest GWI values with figures published in our previous reports.
Please also refer to our comprehensive notes on data to learn about other recent changes.
The complete report
You’ll find our complete Digital 2025 July Global Statshot Report in the embed below (click here if that’s not working for you), but read on past that to find an in-depth analysis of what all these numbers actually mean for you and your work.
The global state of digital in July 2025
Let’s begin with our usual look at the latest global headlines:
The United Nations’s World Populations Prospects data shows that there are 8.23 billion people living on Earth today, with that figure up by 70 million people (+0.9 percent) since this time last year. The UN’s data also highlights the continuing trend of urbanisation, with 58.3 percent of the world’s population now living in urban centres.
Analysis from GSMA Intelligence indicates that there are 5.76 billion unique mobile users around the world in July 2025, which equates to 70.0 percent of the world’s total population. The global unique subscriber figure has increased by 111 million over the 12 months, delivering annual growth of 2.0 percent. Meanwhile, data from Ericsson shows that smartphones now account for roughly 87 percent of the mobile handsets in use.
At the start of July 2025, the world’s online population had reached 5.65 billion, suggesting that internet penetration now sits at 68.7 percent. Internet user numbers have increased by 146 million (+2.7 percent) over the past year, but 2.58 billion people remain offline at the time of writing.
Kepios analysis indicates that global social media user identities now stand at 5.41 billion, with that figure equivalent to 65.7 percent of the global population. That user figure has increased by 4.7 percent over the past 12 months too, with 241 million new identities starting to use social platforms since July 2024 [note that “user identities” may not represent unique human individuals].
These headline figures offer a valuable overview of the global “state of digital” in July 2025, but in order to understand what people are actually doing online – and how their behaviours are evolving – we need to go deeper into the data.
So, go grab some refreshments, get yourself comfy, and we’ll take a closer look at this quarter’s essential findings.
Search revolution
Over the past two decades, search engines like Google, Bing, and DuckDuckGo have been the starting point for most people’s online activities and purchase journeys.
That’s still largely true today too, but online search behaviours and experiences are changing rapidly, and the impact of these changes will impact everybody who uses the internet – individuals and organisations alike.
So, given the critical importance of these trends, we’ll begin this quarter’s analysis with a deep dive into the changing face of search.
Search traffic
More than 4 in 5 online adults report using online search on a regular basis, with 80.6 percent of respondents in GWI’s latest survey stating that they’ve visited a search engine or web portal within the past month.
This figure ranks search engines third in GWI’s list of the world’s most popular online “properties”, behind messaging apps and social networks.
However, actual use of search engines may be even higher than GWI’s research suggests, because – even if the visit isn’t intentional – many web browsers automatically direct users to search engine results if they enter an incomplete, incorrect, or invalid URL in the address bar.
Indeed, this is likely the primary reason why “Google” remains the top keyword entered into Google’s own search engine.
For broader context, Similarweb reports that Google.com attracted an average of 83 billion visits per month between 01 March and 31 May 2025, from an average of 3.16 billion unique visitors each month.
Now those numbers are already pretty impressive, but other figures paint an even clearer picture of just how important Google has become to the world’s online activities.
For example, Similarweb reports that Google.com accounts for almost 20 percent of traffic to the world’s top 10,000 web domains.
Moreover, figures published by Semrush indicate that Google’s traffic may be even higher than Similarweb’s numbers suggest, with Semrush reporting an average of 105 billion visits per month to Google.com, from an average of 5.87 billion unique devices.
And furthermore, the available data suggests that Google handles trillions of searches every year.
Why we search
But these figures aren’t really surprising, even if they’re still impressive.
Indeed, across the world’s 5.65 billion internet users, “finding information” remains a top motivation for going online, and more than 6 in 10 connected adults (61.3 percent) say that this is one of the primary reasons why they use the internet today.
And we also see remarkable consistency in the use of search engines across demographics.
Retirees are the most likely to tell GWI that they’ve used a search engine in the past month, but GWI currently only polls respondents in this age group across a subset of its survey geographies.
Critically, that subset does not include India or China, where respondents are less likely to say that they use search engines overall.
And if we focus our attention on internet users aged 16 to 64, it becomes clear that there’s actually very little variation by age or gender when it comes to the regular use of search engines.
But this level of demographic consistency is actually highly unusual when it comes to digital behaviours.
For instance, even when it comes to other “ubiquitous” digital behaviours like the use of social media or email, we still see wider variation in the data across ages and genders for these activities than we see in the data for the use of search engines.
Consequently, this level of consistency may indicate that the use of search engines has become something of an inherent online behaviour.
Decline in search engine use
However, GWI’s data suggests that the world’s use of search engines has been declining over recent months.
Four years ago, at the start of 2021, GWI’s survey found that 84.1 percent of online adults had used a search engine within the past month.
However, at the start of 2025, that figure has fallen to 80.6 percent, suggesting that search engines may be losing their coveted position as the starting point of online journeys.
It’s important to highlight that the use of search engines has fluctuated in the interim though, and we actually saw a steady increase in use between Q4 2022 and Q3 2024.
However, the latest figure of 80.6 percent is the lowest for the use of search engines that we’ve seen in GWI’s regular survey.
For context, recent trends may be symptomatic of shorter-term influences such as the news cycle, seasonality, or other “outside” factors, and this data alone does not indicate that search might be “dying”.
Moreover, the number of people saying that they use search engines has fallen by less than two percentage points compared with the recent high of 82.4 percent that we saw in Q2 2024.
But GWI’s survey isn’t the only source that points to a decline in search activity.
Decline in search traffic
Despite the impressive numbers that we saw earlier, traffic to search engines has also been declining over recent years.
Analysis from Similarweb indicates that traffic to Google.com has fallen from roughly 19.8 billion visits per week this time three years ago, to 19 billion visits per week at the end of June 2025.
Admittedly, that’s not exactly a precipitous drop, but it still reveals a four percent decline in Google’s visitor traffic over the past 36 months, which in turn points to the loss of more than a billion searches per week.
Google isn’t the only search engine of course, but it is still the world’s favourite search platform, and analysis from Statcounter indicates that Google delivered almost 9 in 10 search engine referrals in May 2025.
Microsoft’s Bing is the world’s second most popular search engine, attracting more than 1.4 billion visits in May 2025, and accounting for roughly 4 percent of global search referrals that same month.
And interestingly, Similarweb’s data shows that Bing enjoyed impressive growth in visitor traffic between June 2022 and January 2025, with average weekly visits increasing by more than 40 percent during that time.
However, Similarweb’s data also reveals a dramatic fall in Bing’s weekly traffic starting in February 2025.
More specifically, over the past five months, Bing has lost more than 100 million visits per week, equating to a relative decline of almost 25 percent.
Crucially, Similarweb’s latest data puts traffic to Bing.com at just over 315 million visits per week – barely 10 percent higher than the traffic that the platform attracted in June 2022.
And furthermore, traffic to Yandex, Yahoo! Search, and DuckDuckGo has also fallen over recent months.
Conversely, while AI probably isn’t the only factor that’s been driving this change in the world’s search behaviours, it’s still interesting to note that Similarweb’s data shows that ChatGPT alone now attracts more than 1 billion visits each week.
Alternative perspectives: search traffic
Semrush’s data paints a slightly different picture to the trends apparent in Similarweb’s dataset, but the overall outcome is broadly similar.
For example, Semrush’s analysis shows a significant drop in traffic to Google.com between March and June 2023, after which visitor traffic grew steadily until May 2025.
However, Semrush’s latest data show another meaningful decline in Google traffic over recent months, and monthly traffic is now back below where it was in June 2022.
Similar trends are evident in Semrush’s data for traffic to Bing.com too, which points to a meaningful decline in traffic to Microsoft’s primary search property over the past year.
Decline in searches for search
Visitor traffic isn’t the only source of insight into search activity though, and search behaviours themselves can also provide valuable perspectives on how the world’s search behaviours are evolving.
Indeed, one of the most obvious “quirks” in Google Trends data is that “Google” consistently tops the list of queries and keywords that feature in Google searches.
The most plausible explanation for this anomaly is that users only type “google” into their browser’s address bar before pressing “enter”, and the browser then treats the incomplete URL as a search.
Either way though, trends over time in the volume of searches involving “Google” as a keyword may be illuminating.
And sure enough, Google Trends data also shows a meaningful decline in this behaviour.
More specifically, the relative volume share of “Google” as a search keyword peaked in early 2014, and current volumes are almost 60 percent below that peak.
Even if we focus on more recent time periods, Google’s own data suggests that the relative volume of searches for “Google” has fallen by roughly 40 percent since September 2020.
For comparison, search activity involving “Bing” as a keyword spiked in late 2023, but Google searches for this keyword have subsequently fallen by 75 percent, and current volumes are now lower than they were before that recent spike.
Having said that, Google searches for DuckDuckGo have actually increased over the past 5 years, and recent search activity including “DuckDuckGo” as a keyword is roughly 2½ times higher than it was in mid 2020.
However, DuckDuckGo’s relative share of search volume has fallen by more than 50 percent since its peak around this time last year.
And furthermore, Google Trends data suggests that people are roughly 90 times more likely to search for Google than they are to search for DuckDuckGo, so the latter’s performance does little to impact overall trends in the search category.
Why search trends matter
So, the overall takeaway from the data that we’ve explored so far is that the use of search engines appears to be declining.
But why might that matter?
Well, from a business perspective, search traffic is the lifeblood of digital marketing.
Search’s role in advertising
As we saw in our flagship Digital 2025 Global Overview Report back in January, search accounted for 40 percent of digital ad spend in 2024 – more than any other channel.
At a worldwide level, Statista reports that advertisers spent more than USD $316 billion on search advertising in 2024, with that figure up by more than 12 percent compared with the previous year.
And given that digital channels accounted for nearly three-quarters of total ad spend last year, it’s safe to say that online search was marketers’ top advertising medium in 2024.
Moreover, search accounted for more than half of all digital ad spend in a number of countries last year – notably the United Kingdom – while it accounted for more that 43 percent of online ad spend in the United States.
And recent data suggests that search ad spend is on track to increase in 2025 too, with Alphabet’s Q1 2025 investor earnings indicating a 10 percent year-on-year revenue increase in its “Google Search & Other” division.
But given the trends we saw above, should marketers consider revising their search advertising plans and investments?
Well – perhaps surprisingly – other data in this quarter’s reports suggests that would be somewhat premature.
Search’s role in brand discovery
First up, the latest data from GWI indicates that search engines remain the primary source of discovery when it comes to new brands, products, and services, ahead of TV ads, social media ads, and word of mouth.
Indeed, GWI’s data indicates that search is the only channel that introduces new brands to more than 1 in 3 online adults, which suggests that it’s still a crucial channel for marketers hoping to raise awareness.
And crucially, while data suggests that overall search activity may be declining, GWI’s data shows a steady increase in the share of online adults who cite search engines as a primary source of brand discovery.
More specifically, the share of internet users aged 16 and above who select this answer option has increased by 2.5 percentage points over the past two years, which equates to more than 100 million additional shoppers.
Search’s role in brand research
And search isn’t just important in the early stages of the buyer journey.
GWI’s survey also reveals that search engines are the number one destination when people are researching potential purchases, with more than half of the world’s online adults selecting this answer option.
Having said that, younger internet users say they’re more likely to choose social networks when researching potential purchases, and social networks are also the dominant choice across South-Eastern Asia
The role of search referrals
And despite the huge amount of money that marketers spend on paid search ads, organic search is still the dominant source of website visits after “direct” traffic [note that direct traffic includes users who type the site’s URL directly into their browser].
The exact role of each traffic source varies meaningfully by industry, but it’s worth highlighting that brand websites still play a crucial role in the typical “buyer journey”.
For example, GWI’s latest data indicates that 44 percent of online adults have visited at least one brand website within the past month, and people are still significantly more likely to visit a brand’s website than they are to engage with brands on social media.
As a result, organic web traffic is still a hugely valuable part of the marketing mix.
However, that opportunity is increasingly under threat: alongside the overall decline in traffic heading to search engines, we’ve also been tracking a steady decline in the referral traffic coming back out of Google.
Google’s share of referrals declines
Given Google’s dominance, it’s perhaps not surprising to learn that the site still accounts for close to 9 in 10 referrals that originate from search engines.
However, the latest data from Statcounter shows that Google’s relative share of search engine referrals to third-party websites has fallen by roughly 3.8 percentage points since February 2023.
And while this figure appears to be quite similar to the 4 percent decline in visitor traffic to Google.com during that same period, a change in the number of visits to Google’s website does not appear to be the primary cause of this decline in third-party referrals.
For clarity, Statcounter’s figures identify the share of referral traffic coming from search engines, but Kepios analysis indicates that Google’s share of traffic going to search engines has remained remarkably stable over the past three years.
In other words, while overall traffic to Google.com has been declining over recent years, the same is true of other top search engines like Bing, Yahoo!, and DuckDuckGo.
And in fact, data from Similarweb suggests that Google’s current share of traffic going to the top 4 search engines outside of China and Russia is only 0.08 percent lower than it was this time three years ago.
And crucially, Google’s relative share of traffic to these top search engines has actually increased steadily over the past two years.
Consequently, the apparent decline in referral traffic revealed in Statcounter’s data suggests that Google is simply converting fewer searches into referrals to third-party domains.
And therein lies one of the most important findings in this quarter’s data.
The source of answers
More specifically, despite its search ads division accounting for close to two-thirds of Alphabet’s total revenue, Google appears to be proactively reducing the volume of traffic that its search properties send to third-party websites.
It’s difficult to put an exact number on the absolute impact of these changes, but our analysis of the available data suggests that Google now refers hundreds of millions fewer visitors each month to external web properties than it did this time three years ago.
And perhaps more importantly – in contrast to the startling findings of our recent study into the decline of traffic to Wikipedia – it appears that this decline in third-party referrals is due in large part to the rise of Google’s AI Overviews, as well as the platform’s other “zero-click” search offerings.
Now admittedly, in many cases, zero-click results offer a highly compelling search experience for users.
For example, if someone searches for the capital city of Uganda, or how many grams are in an ounce, they’re more likely to be looking for quick answers than for a redirect to a third-party website.
Indeed, if the answer to a search query is relatively straightforward and uncontentious, an AI Overview will usually be sufficient – at least from the user’s perspective.
However, if an answer requires a multidimensional response or additional nuance, AI Overviews pose a number of challenges.
For starters, although Google is starting to do a better job of identifying the sources that inform its AI overviews, these summaries often blend results from multiple sources, and in many cases, it can be difficult for users to match the presented “results” with the cited sources.
As a result, it can be challenging for users to verify the accuracy and reliability of the information presented in AI overviews – if they even realise they might need to do so.
The reckoning
Perhaps more importantly though, AI overviews reduce the traffic that web publishers rely on for survival.
For perspective, Google claims that its AI overviews deliver higher click-through rates, with Alphabet CEO Sundar Pichai asserting:
“If you put content and links within AI Overviews, they get higher clickthrough rates than if you put it outside of AI Overviews.”
However, as we saw earlier in this analysis, the rise of Google’s AI Overviews has coincided with a meaningful decline in the overall traffic that Google refers to third-party websites.
In turn, this reduction in traffic results in reduced ad revenue for publishers, and fewer opportunities for them to attract paying subscribers.
As a result, AI Overviews and summaries are starving publishers of the financial resources they need to produce the very content upon which AI platforms rely.
Put simply, the current AI model is unsustainable.
And crucially, arguments about whether AI content is “transformative”, or whether its use of copyrighted content constitutes “fair use”, are largely moot if publishers can no longer afford to produce original content in the first place.
As a result, it seems likely that we’ll see a fundamental realignment of the publishing industry over the coming months, much like the realignment that we saw in the music industry following the rise of Napster and Spotify.
However, with many publishers already struggling to keep the lights on, it seems inevitable that some won’t survive long enough to benefit from that realignment.
And furthermore, Google’s AI Overviews aren’t the only AI threat that publishers need to worry about.
ChatGPT soars to new heights
Data from Similarweb shows that ChatGPT enjoyed an average of more than 5 billion visits per month during the second quarter of 2025, with OpenAI’s flagship domain attracting a total of more than 16 billion total visits between April and June.
That’s enough to place the site fifth in Similarweb’s latest analysis of global web traffic, although ChatGPT still ranks below many of the world’s other top domains in terms of unique visitor numbers.
Having said that, it’s important to highlight that estimates of the platform’s unique user base vary meaningfully between analysts.
For example, Similarweb reports 411 million unique monthly visitors to ChatGPT.com in May 2025, whereas Semrush reports 597 million unique visitors for the same period.
This means that Semrush’s reported figure for unique web visitors is roughly 45 percent higher than Similarweb’s equivalent number.
Meanwhile, Similarweb’s App Intelligence data indicates that ChatGPT’s mobile app had roughly 486 million monthly active users combined across its iOS and Google Play apps in May 2025.
And for added perspective, GWI’s latest wave of research shows that 22.3 percent of online adults across 54 of the world’s largest economies used ChatGPT within the past month, which points to an active user base of more than 700 million monthly active users.
For comparison, OpenAI’s CEO, Sam Altman, recently suggested that ChatGPT “users” are likely somewhere between 800 million and 1 billion, but it’s important to stress that these figures may not indicate regular, active users.
Having said that, at the time of the company’s funding update in March 2025, OpenAI reported that it already served 500 million active users per week.
So, based on all of these figures, it seems likely that well over half a billion people make active use of ChatGPT each month.
Understanding ChatGPT use
But GWI’s research suggests that ChatGPT’s popularity varies meaningfully around the world.
For example, more than 4 in 10 connected adults in Kenya, the UAE, and Israel say that they used ChatGPT within the past month, and most countries in GWI’s survey see ChatGPT use in excess of 25 percent.
However, OpenAI’s flagship service is significantly less popular in Japan, where barely 5.8 percent of connected adults say they used the service in the past month.
And it’s also interesting to note that self-declared usage rates fall well below the global average in the United States, the United Kingdom, Germany, and France.
GWI’s data also shows a marked gender skew when it comes to ChatGPT use, and – relatively speaking – men are almost 25 percent more likely to use ChatGPT than women are.
And similarly, ChatGPT use also appears to decline meaningfully with age.
At a worldwide level, 37 percent of internet users aged 16 to 24 say that they used ChatGPT within the past month, compared with just 5.3 percent of internet users aged 65 and above.
Enthusiasm for AI
Looking beyond individual platforms, close to half of all connected adults in GWI’s survey are enthusiastic about artificial intelligence.
The company’s latest survey found that 48.5 percent of internet users aged 16 and above are “excited” about AI, with that figure up from 46.9 percent this time last year.
However, this particular metric doesn’t appear to be growing with the same fervour as media coverage might have you believe, and it’s worth highlighting that fewer than half of survey respondents currently express active enthusiasm for AI.
Meanwhile, as is so often the case, levels of excitement vary meaningfully by geography.
At the top end of the scale, nearly three-quarters of online adults in Turkey (74.4 percent) express enthusiasm for AI, with Nigerians not far behind.
Likewise, more than two-thirds of connected Ghanians say that they’re excited about AI, and that figure remains above 60 percent in Brazil, Israel, Egypt, and Vietnam.
Conversely, people in New Zealand are the least likely to express excitement about AI, with fewer than 3 in 10 Kiwis saying that they’re excited about the technology.
Brits and Americans also appear to be sceptical, with barely 30.6 percent of survey respondents in the United Kingdom saying that they’re excited about artificial intelligence, and that figure only rising to 32.1 percent in the United States.
Turning our attention to demographics, men appear to be markedly more enthusiastic about AI than women.
GWI’s data shows that 52.6 percent of male internet users are “excited” about AI, compared with just 44.2 percent of female internet users.
Relatively speaking, that means men are roughly 19 percent more likely to express enthusiasm about AI than women are.
And it also appears that excitement about AI wanes with age.
Amongst younger users, more than half – 53.1 percent – of internet users aged 16 to 24 say that they’re excited about AI, but that figure falls to just 28.2 percent amongst retirees.
World’s most used AI services
The latest data indicates that OpenAI has a comfortable lead at the top of the AI leaderboard in July 2025, but ChatGPT isn’t the only AI platform that’s gaining momentum.
For example, Similarweb’s data indicates that Google Gemini’s standalone website attracted more than 100 million unique visitors in May 2025, and this figure doesn’t even include people who make use of Gemini within the company’s broader suite of offerings like Gmail and Google Docs.
And while Deepseek appears to have lost some of its initial momentum, the platform’s website still attracted more than 60 million unique visitors in May 2025.
No other service attracted more than 50 million unique visitors to a dedicated AI web domain in May 2025, but Grok, Microsoft Copilot, Perplexity, and Claude all attracted more than 10 million unique visitors to their standalone AI platforms on the web during that month.
But to put these figures in perspective, ChatGPT sees almost four times as many users to its website as its next nearest competitor, with ChatGPT.com attracting 411 million unique visitors in May 2025.
Meanwhile, data for AI mobile app use tells a slightly different story.
Despite placing just fifth in our website rankings, Microsoft has been considerably more successful in driving use of its Copilot apps, and Similarweb’s App Intelligence data suggests that the platform enjoyed 151 million combined monthly active users across its Google Play and iOS-listed apps in May 2025.
Deepseek’s mobile app is also more successful than its website, with the platform delivering 75 million combined MAUs in May 2025.
Google’s Gemini app places fourth in this ranking, with the platform’s Google Play and iOS mobile apps delivering combined usage of 58.7 million monthly active users in May 2025.
Once again though, ChatGPT’s mobile app appears to be in a league of its own, with the platform’s apps enjoying a combined total of 486 million monthly active users in May 2025.
Most people have smart TVs
The latest data from GWI shows that more than half of internet users aged 16 and above now own a “smart” TV.
The share of online adults that owns one of these devices has been growing steadily over recent months, and on a relative basis, smart TV ownership has increased by close to 10 percent in just the past two years.
Ownership varies meaningfully by country though, and there are some surprises in this geographic data too.
For example, despite the country’s historical reputation for being at the forefront of TV innovation thanks to homegrown brands like Sony, ownership of smart TVs in Japan stands at just 13.2 percent – less than half the figure we see in any other country.
Adoption rates are also lower across less developed economies, especially in Africa.
However, at the other end of the scale, nearly three-quarters of Brazilian internet users now own a smart TV, while the same is true of more than two-thirds of online adults in Italy, Norway, Chile, and the United Kingdom.
And somewhat surprisingly, the likelihood of owning a smart TV seems to increase with age.
GWI’s data shows that nearly 6 in 10 online males aged 55 to 64 own a smart TV today, compared with fewer than 4 in 10 internet users aged 16 to 24.
Connected TVs
However, despite encouraging ownership trends, data suggests that a meaningful number of smart TV owners have yet to connect their devices to the internet.
For example, fewer than 1 in 3 online adults – 32.1 percent – say that they access digital content on their television each month.
And age appears to be an important consideration here.
Indeed, despite being meaningfully more likely to own a smart TV device compared with younger generations, online retirees are only slightly more likely to access digital content on a TV than internet users aged 16 to 64.
For perspective, this may in turn relate to the consumption of streaming TV content.
More than 7 in 10 internet users over the age of 65 say that they watch streaming content on platforms like Netflix each month.
However, that’s considerably lower than the figures we see for younger age groups, with more than 9 in 10 internet users below the age of 55 saying that they watch streaming content each month.
GWI’s data also suggests that older generations are less likely to watch online videos via platforms like YouTube, with figures for this activity remarkably similar to those we see for the consumption of streaming TV content.
However, it’s important to stress that – once again – things vary meaningfully by geography.
For example, YouTube’s latest ad reach data indicates that marketers can reach a hefty 98 percent of the platform’s total audience in the United States via ads on connected TVs.
And given that users over the age of 65 now account for the largest share of YouTube’s US audience, it’s clear that connected TV represents an increasingly compelling opportunity for advertisers, even when it comes to older generations.
Streaming ahead
And we’re sticking with TV for our next story too.
GWI’s latest data reveals that streaming platforms now account for more than half of all the time that the world’s online adults spend watching television.
The company’s recently revised approach to measuring the time that people spend with media shows that streaming platforms like Netflix and Disney+ now account for 50.1 percent of the total time that the world’s connected adults spend watching any kind of TV.
But we still see meaningful variation by country.
For example, streaming accounts for almost two-thirds of TV time in New Zealand, but less than one-fifth of TV time in Japan.
But streaming’s share of TV time looks set to continue climbing, with GWI’s data indicating that an increasing number of people are paying for streaming subscriptions.
The latest data show that close to 1 in 3 connected adults now pay for a streaming subscription, but it’s worth highlighting that most households will likely share one subscription, suggesting that most “connected households” will now have access to at least one paid streaming service.
And furthermore, more than 9 in 10 online adults now say that they stream TV content over the internet.
At a worldwide level, 92 percent of internet users aged 16 and above accessed TV and movie content via streaming services in the past month, with that figure rising to an impressive 98.5 percent in Mexico.
At the other end of the spectrum, just 72.1 percent of Japanese internet users say that they streamed TV content over the internet in the past month, but even then, that’s a fairly healthy figure.
Online video outranks TV
But despite the rise of streaming, GWI’s data indicates that people now spend more time watching online video content than they spend watching TV, even when that TV figure includes streaming.
Admittedly, this is a somewhat contrived comparison, because the demarcation between what constitutes online video versus streaming TV is academic at best.
However, this finding is still interesting, because it highlights how the world’s content consumption behaviours have evolved.
In total, people say that they spend an average of 11 hours and 39 minutes per week consuming online video content across platforms like YouTube and TikTok, compared with an average of 10 hours and 15 minutes watching TV via terrestrial broadcast and cable channels and streaming platforms like Netflix.
That means people now spend roughly 14 percent more time consuming online video than they spend watching television.
But perhaps the more interesting finding in this dataset is that short videos like TikToks now account for a greater share of online video time than longer video content like vlogs.
GWI’s survey respondents report spending an average of 6 hours and 42 minutes per week consuming Reels, TikToks, and the like, compared with 4 hours and 57 minutes per week for longer online video content.
And for added context, people also say they now spend more time watching short videos than they spend watching streaming platforms.
Feeding attention
But slicing this data yet another way, perhaps the most telling takeaway is that social media feeds now capture more of our attention than TV does.
More specifically, if we add the time that the world’s adult internet users spend scrolling feeds in social networks like Facebook and X to the time that we spend using short video platforms like TikTok, the combined total comes to an average of 13 hours and 48 minutes per week.
That’s a full 3½ hours longer – or 35 percent more – than the time people say they spend watching television, including streaming TV.
And that ratio is even more striking when we look at the behaviours of younger generations.
For example, women aged 16 to 24 say that they spend an average of just 9 hours per week watching television, compared with an average of 19 hours and 46 minutes per week scrolling social media and short video feeds.
In other words, Gen Z women now spend 2.6 times longer using platforms like Instagram and TikTok than they spend watching any kind of TV content.
And this “social skew” isn’t restricted to younger generations either.
Indeed, GWI’s data shows that it’s only once we reach ages 55 and above that people say they spend more time watching TV than scrolling social feeds.
The medium is not the message
As I noted earlier though, many of these comparisons are rather contrived, because the average person in our audiences doesn’t think in terms of “watching TV” versus “short videos” or “long videos”.
Rather, “normal” people think about what they want to watch, and how they might watch it, right here, right now.
Sometimes, that might involve watching The Bear on a tablet while they’re riding the subway.
Sometimes, it might mean watching MrBeast on a 65” TV screen while they’re sitting on the sofa with their partner.
And other times, it might mean scrolling an hour’s worth of Reels while they’re lying in bed.
Each of those “sessions” delivers a very different kind of experience and benefit, and I believe that’s where marketers should focus their attention.
In other words, don’t start with content formats and delivery media.
Instead, start with the kind of “audience experience” that you hope to create or tap into, and work backwards from there to identify the most appropriate media opportunities.
Top platforms in July 2025
Having said that, given the obvious importance of social media and online video in people’s daily lives, it might be helpful at this point to explore how some of the top platforms have been performing.
And the good news is that we have an expanded collection of data to explore this quarter, because the wonderful folks at GWI have enabled us to include their data on the use of a range of popular platforms.
So who’s top of the feeds?
Well, interestingly, there’s no clear “winner” at the top of the global platform rankings, because different datasets offer different perspectives on people’s behaviours and preferences.
However, each of these datasets offers valuable findings and perspectives, so let’s explore them one by one.
The world’s most used social media platforms
When it comes to “self-declared” platform usage, GWI’s latest survey finds that Facebook is the most widely used social media platform around the world.
More specifically, 56.6 percent of respondents in GWI’s Q1 2025 wave of research said that they used Facebook at least once in the past month, compared with 55.3 percent for second-ranked YouTube, and 54.5 percent for third-placed Instagram.
WhatsApp is the only other platform used by more than half of all the world’s online adults, with 54 percent of respondents saying they’d used the world’s most popular messaging platform within the past month.
For context, GWI’s research is based on a comprehensive survey of more than 240,000 online adults aged 16 and above across 54 of the world’s larger economies.
Looking deeper into GWI’s data, it’s interesting to note that Facebook use has remained stable over the past two years, with variance contained within a band of just 1 percentage point since the start of 2023.
YouTube use has also remained relatively stable, but – with a gap of 2 percentage points between its relative highs and lows – the platform has seen slightly more variation than Facebook.
Meanwhile, Instagram and WhatsApp have both enjoyed gentle growth in use amongst online adults over the past two years, with WhatsApp in particular seeing self-declared use increase by a relative 5 percent between Q1 2023 and Q1 2025.
WhatsApp also enjoys the highest adoption figure within a single country of any platform in GWI’s survey, with 98.3 percent of respondents in both Morocco and Nigeria saying that they used Meta’s top messaging platform within the past month.
Most used social media apps
However, when we turn our attention to what people are actually doing on their phones – as opposed to what they say they do – a slightly different story emerges.
Similarweb’s App Intelligence data, which consensually tracks actual use of mobile apps on a large number of smartphone handsets around the world, indicates that YouTube is currently the most widely used platform.
Note that we report these app user numbers as an “index” relative to the monthly active user figures of the top app, so the most used platform will always have a ‘score’ of 100.
And this latest Similarweb data shows us that – on a relative basis – YouTube has 14 percent more monthly active users than its next nearest rival, WhatsApp, which has an index of 87.6.
Facebook ranks third with an index of 76.2, but this means that YouTube’s active app user base is more than 30 percent larger than Facebook’s.
Instagram ranks fourth with 71.7, and TikTok rounds out the top 5, with 53.8.
Top of the social web
Just for completeness, it’s also worth exploring traffic to social platforms’ websites, but please note that this comparison will disproportionately under-represent platforms like Snapchat.
Using Similarweb’s data, YouTube comes out top amongst social media and video sites, with the platform’s primary dotcom domain attracting close to 1.75 billion unique visitors in May 2025.
Facebook ranks second with 1.03 billion unique site visitors, but Instagram is only just behind its stablemate, with just over 1 billion unique monthly visitors in May 2025.
Somewhat surprisingly given its mobile-centric user experience, TikTok’s website ranks fourth, with Similarweb reporting 844 million unique visitors to tiktok.com in May 2025.
And Reddit rounds out the top five, attracting just under 700 million unique visitors to its website in May 2025.
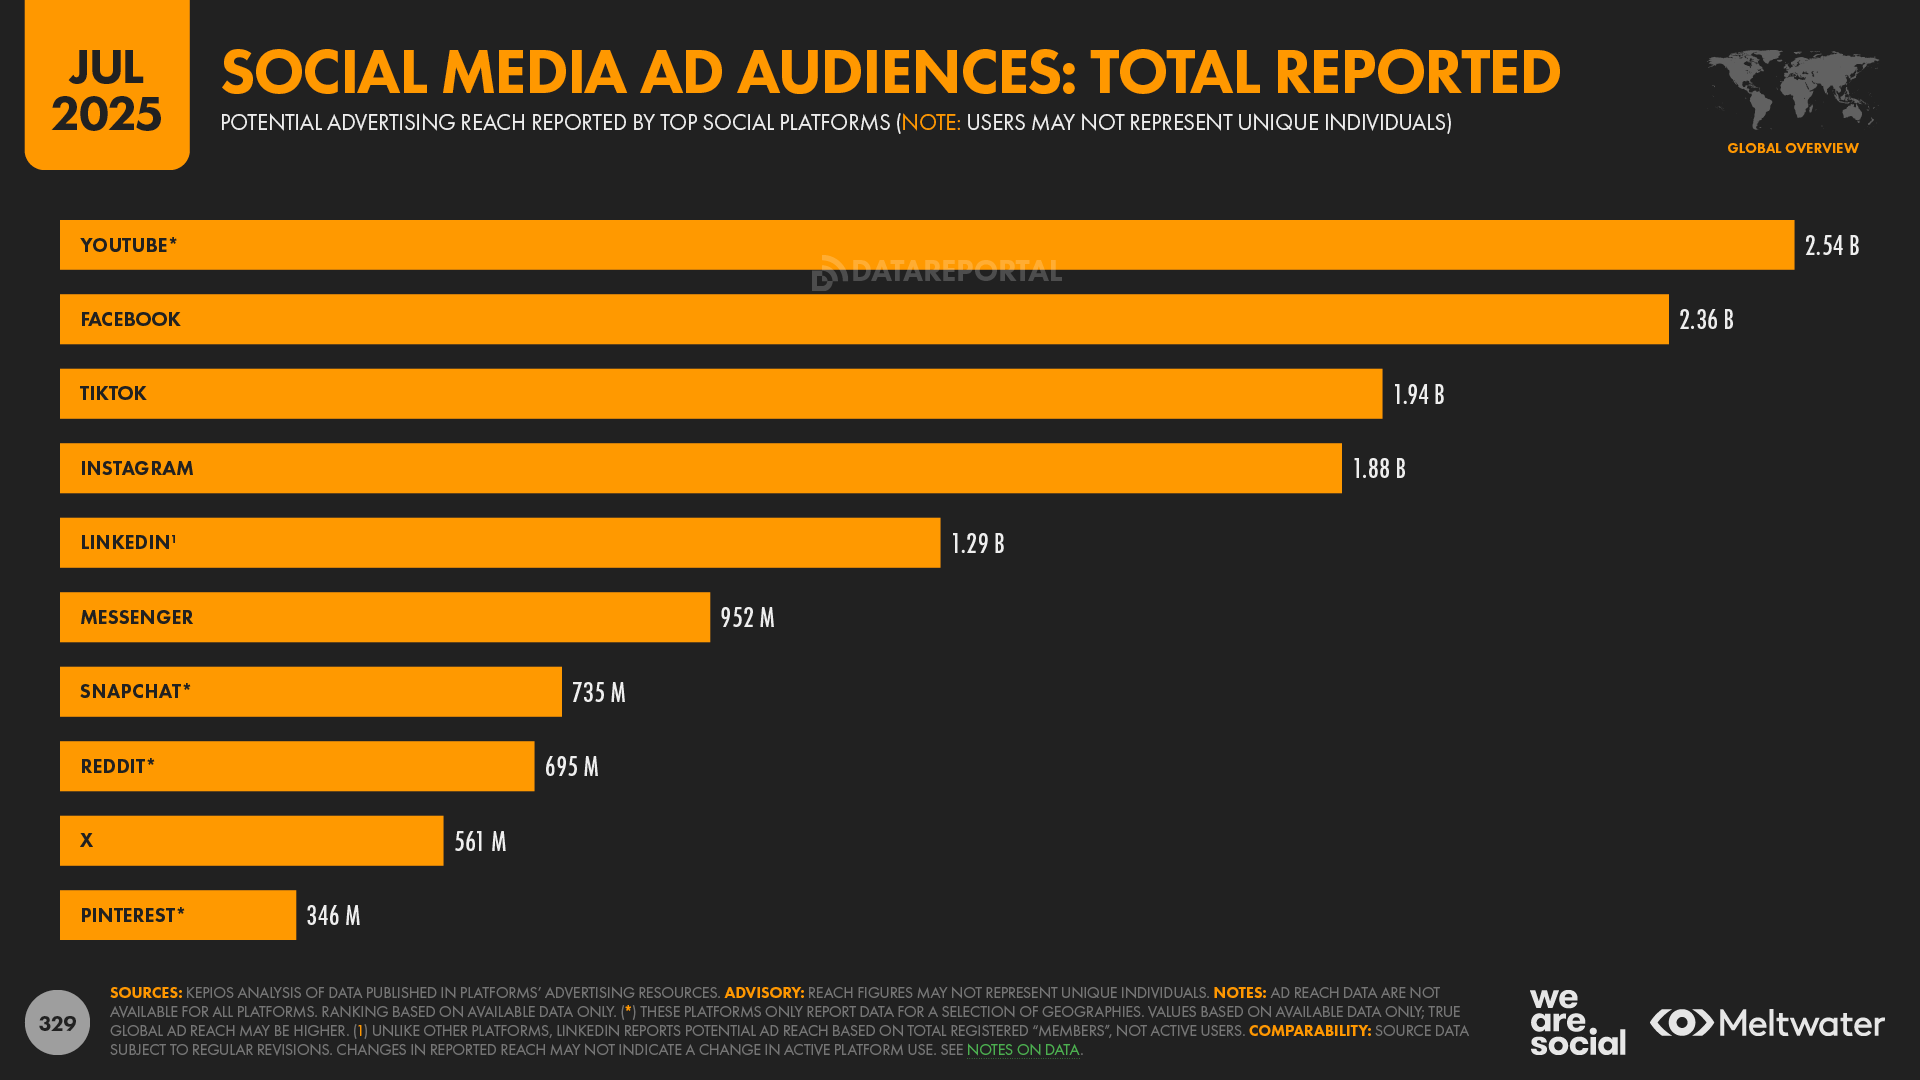
Reported reach of social media ads
Meanwhile, the ad reach figures reported by the companies themselves offer yet another perspective on social media platform use.
Based on data published in each platform’s respective ad planning tools, YouTube claims the largest global ad reach, with a reported potential audience of 2.54 billion.
However, it’s important to note that YouTube’s planning tools only show data for 88 countries and territories, and while these geographies account for roughly 80 percent of the world’s internet users outside of China, there’s a good chance that YouTube’s total ad reach is higher than these reported figures indicate.
Next up, Meta’s figures suggest that Facebook has the world’s second largest social media ad audience, with the company’s self-service tools indicating potential global reach of 2.36 billion.
TikTok ranks third based on the latest platform-reported ad reach data, with Bytedance’s tools reporting total potential reach of 1.94 billion.
Bytedance only reports audience figures for audiences aged 18 and above, which suggests that total TikTok reach may be even higher than these reported figures suggest.
However, Bytedance’s reported ad reach already exceeds the United Nations’ figures for total population in a number of countries, so it’s unclear whether TikTok’s total reach could be higher than the reported reach figure in those markets.
Making sense of social stats
So, as you can see, there’s no definitive answer to the question, “what’s the top social platform?”
Based on all the available evidence, Kepios’s analysis suggests that YouTube likely has the largest active audience, but even then, we’d only put it marginally ahead of Facebook.
Moreover, this quarter’s expanded social media dataset illustrates just how important it is to explore the specific nuances of your audience.
For example, if you’re hoping to reach young women, it’s well worth knowing that – at a worldwide level – almost as many women aged 16 to 24 say that they use Pinterest (44.7 percent) as say they use TikTok (47.3 percent).
However, marketers may be even more surprised to learn that Facebook attracts an even greater share of this audience, with more than half of connected women aged 16 to 24 (50.3 percent) saying that they used Facebook at least once within the past 30 days.
Instagram appears to be the top choice amongst this particular demographic though, with almost 7 in 10 women in this younger age group (69.2 percent) saying that they use Instagram each month.
And there are plenty of learnings when it comes to the behaviours of younger men too, most notably the popularity of Telegram (46.5 percent) and X (42.6 percent) amongst men aged 16 to 24.
Meanwhile, at the other end of the age spectrum, Facebook is still a hugely valuable opportunity when it comes to engaging older audiences, with well over 6 in 10 internet users aged 65 and above saying that they’ve used the “big blue” platform within the past month.
Ranks can be distracting
But perhaps the most important takeaway from all this data is that marketers have a wide variety of large and compelling platforms to choose from, and our industry’s obsession with “rankings” may actually be detrimental to better planning.
So, my advice here is to look beyond platform user numbers, and to focus your attention on the user experiences that you hope to deliver and tap into.
Once you’ve identified those experiences, it should become much easier to identify which kinds of content are best suited for delivering your intended “message”, and that in turn will make it easier to identify the optimum channel(s) for your specific objectives.
And lastly, remember that there are significant overlaps between the audiences of all of these top platforms, and as a result, you may be able to reach exactly the same people for a smaller investment by exploring a different mix of platforms.
Online grocery gaining momentum
Turning our attention to ecommerce, GWI’s latest wave of research shows that online grocery shopping has returned to levels that we last saw during the heady days of the Covid-19 pandemic.
More specifically, 28.7 percent of online adults say that they ordered groceries via an online shopping platform within the past week, which is the highest figure we’ve seen in the past two years.
And furthermore, it’s worth considering that – in many cases – just one person in each household takes responsibility for buying groceries.
As a result, these GWI figures suggest that more than half of all “connected households” may now buy at least some of their groceries online.
Asia leads the way in online grocery shopping, with more than 4 in 10 internet users aged 16 and above in Thailand, South Korea, the UAE, and Turkey saying that they bought groceries online within the past 7 days.
Online grocery shopping is considerably less popular in Europe though, with only the UK and Greece seeing weekly use in excess of 20 percent.
Data also shows that women are meaningfully more likely than men to order groceries online, while families with younger children tend to be the most ardent users of online grocery services.
However, it’s interesting to note that older generations are still considerably less likely to buy their groceries online.
This may be partly because retirees have fewer time pressures compared with working parents with young children, and some older people may also treat grocery shopping as something of a social experience.
Having said that, people aged 50 and above account for more than half of all consumer spending across many of those markets where online grocery shopping falls below the global average, and as a result, online grocery retailers may want to explore how they can offer more compelling experiences for older generations.
Internet speeds pass major milestone
The latest data from Ookla shows that the typical fixed internet connection now delivers bandwidth of more than 100 Mbps.
Worldwide, fixed internet users enjoyed a median “wired” download speed of 102.48 Mbps in May 2025, with that figure almost 10 percent higher than the equivalent bandwidth figure from a year earlier.
Singapore enjoys the world’s fastest fixed internet speeds, with the median wired connection in the country delivering bandwidth of more than 370 Mbps.
Similarly, the median bandwidth of fixed internet connections now exceeds 300 Mbps in France, the UAE, and Hong Kong.
Many countries still struggle with relatively slow speeds though, and fixed internet bandwidth remains below 10 Mbps in Syria, Cuba, and Afghanistan.
Mobile speeds catching up
Mobile internet speeds are growing much more quickly than fixed speeds though, and trends in Ookla’s data suggest that it may not be long until fixed internet connections overtake wired ones.
The company’s Speedtest data shows that the median mobile data connection delivered download bandwidth of 92.82 Mbps in May 2025, which is less than 10 percent slower than the median fixed connection equivalent.
More importantly however, the median mobile connection speed has jumped by 68.6 percent over the past year, so it may only be a matter of a few months before mobile data connections take the lead.
And in fact, in many countries this is already the case, with Ookla’s data indicating that mobile connections now outpace fixed connections in more than 100 countries.
But faster connections also mean that the world is consuming ever more mobile data.
The latest analysis from Ericsson shows that the world’s smartphone users transferred a combined average of more than 170 billion gigabytes of cellular per month in the first quarter of 2025, at an average of more than 21 GB per handset.
Cellular data consumption continues to increase too, with the global monthly total increasing by more than 18 percent over the past year.
Browsers become a battleground
Earlier this month, two of the world’s most popular AI service providers – OpenAI and Perplexity – announced that they are launching their own web browsers.
Techcrunch reports that Perplexity’s “Comet” browser will initially only be available to subscribers of the platform’s $200-per-month “Max” plan.
However, Perplexity’s CEO, Aravind Srinivas, has stated that the broader vision for Comet is to develop an “operating system” that enables users to employ Perplexity across apps and websites.
Meanwhile, Reuters reports that OpenAI is launching a browser to help “keep some user interactions within a ChatGPT-like native chat interface,” reducing the need for ChatGPT users to click through to other websites.
The Reuters article goes on to suggest that the browser launch is “part of a broader strategy by OpenAI to weave its services across the personal and work lives of consumers.”
However, both companies may have an uphill battle ahead of them.
The dominance of Chrome
Data from Statcounter suggests that Google’s Chrome browser now accounts for twice as much web traffic as all other browsers combined.
More specifically, Chrome captured 66.85 percent of web pages served to browsers worldwide in May 2025, which equates to more than two-third of total global web traffic.
Apple’s Safari browser ranked second, accounting for 17.19 percent of global traffic, while third-placed Microsoft Edge only accounted for 5.21 percent.
Just four more browsers – Firefox, Samsung Internet, Opera, and Android – captured more than 1 percent of global web traffic, while all other browsers combined accounted for just 3.32 percent.
It’s also interesting to note that Chrome has increased its market share over the past year, with Google’s share of the browser market climbing by a relative 2.7 percent between May 2024 and May 2025.
Having said that, things can change quickly in the online world, and there’s nothing to say that Perplexity and OpenAI won’t be able to capture a meaningful share of the market – especially if their browsers offer something new.
However, with Google and Apple accounting for more than 99 percent of the mobile handset market – and 84 percent of the browser market – these new entrants have significant hurdles to overcome.
Wrapping up
That concludes this quarter’s analysis, but remember that you’ll find loads more data in our complete Digital 2025 July Global Statshot Report, which you’ll find embedded at the top of this article.
If you have any questions about this quarter’s data – or if you’d just like to say hello – you can find me on LinkedIn as Simon Kemp.
And don’t forget that you can find all of our Global Digital Reports from the past 15 years in our (free!) DataReportal library, which also includes local market reports for almost every country in the world.
That’s all for now though; I’ll be back on your screens again in October, when I’ll be bringing you a special surprise.
Click here to see all of Simon’s articles, read his bio, and connect with him on social media.