
Digital 2027: Internet Use Around the World
DataReportal’s Digital 2027 suite – published in partnership with Meltwater and We Are Social – shows that connected tech is now pervasive in most people’s lives.
However, as we’ve seen consistently throughout the 15 years we’ve been producing these reports, levels of internet adoption and the quality of online experiences vary meaningfully around the world.
People’s reasons for using the internet also vary by geography, age, and gender, and the same is true of the mobile apps and websites they use to satisfy their motivations.
We’ve covered some of the most newsworthy trends in the Digital 2027 data in our headline analysis of this year’s flagship Global Overview Report, but this article takes a closer look at the essential context that underlies each of those trends.
Headlines for internet use
Manochi’s analysis of the latest data from organisations including the ITU, GSMA Intelligence, and Eurostat indicates that nearly three quarters of the world’s total population – 6.15 billion people – now use the internet.
That figure has increased by more than 10 percent over the past 3 years, with data indicating that global internet users sat just below 5.5 billion in October 2023.
Current figures indicate that global internet adoption now stands at 73.9 percent, but if we focus on individuals aged 16 and above, the global internet adoption rate rises above 80 percent.
And for added context, GSMA Intelligence reports that there are now more than 5.86 billion unique mobile subscribers.
Of that total, several hundred million subscribers do not use their mobile device to access the internet, but on the other hand, 650 million people access the internet using somebody else’s phone (e.g. a parent’s handset), and a meaningful number of people also only access the internet via laptop and desktop computers.
Data delays
As we stress each year though, the latest reported user figures likely undercount actual internet use by a meaningful margin, largely due to the significant amount of time that it takes to collect, process, and publish research into internet use.
For context, representative research into whether people use the internet can only be reliably conducted offline, because – obviously – online research would categorically miss all non-users.
However, offline research involves significantly greater time and resourcing requirements compared with online surveys, which helps to explain why figures for internet use often lag metrics like social media adoption.
As an example, when we produced our Digital 2024 October Global Statshot Report, the latest data at the time indicated that there were 5.52 billion internet users.
Fast forward two years though, and data that has been published since then indicates that the actual user figure for October 2024 is 400 million higher than the initial research suggested, with current data putting the global total for that month at 5.92 billion users.
There’s no easy way to identify the extent to which current data undercounts today’s internet user total, but if we look at annual growth trends for the past few years, it doesn’t seem unreasonable to assume that global adoption has already passed the 75 percent mark, which would require at least 6.24 billion users.
That’s just 90 million more than the figure we’ve published in the current report.
So, broadly speaking, we can say that roughly 3 times as many people use the internet today as do not.
Internet adoption around the world
However, internet adoption rates still vary meaningfully around the world.
At the top end of the scale, reports indicate that internet adoption rates exceed 99 percent in a total of 13 different countries around the world, with almost all of these countries in the Arabian Gulf or Northern and Western Europe.
Meanwhile, 80 distinct countries and territories enjoy internet adoption rates above 90 percent.
Almost all of the world’s largest economies see internet use above 80 percent, but rates still lag behind the global average across much of Southern Asia and Africa.
China and India account for close to 38 percent of the world’s total internet population, with these two countries alone home to 2.33 billion users.
The United States ranks third, with the country’s 331 million internet users representing roughly 5.4 percent of the global total.
However, despite placing third in the connectivity rankings by absolute number of internet users, it’s critical to remember that 94.6 percent of the world’s internet users live outside the United States, which highlights the importance of looking beyond America’s online preferences and behaviours when trying to make sense of digital trends.
Billions still offline
At the other end of the adoption spectrum, North Korea still languishes in last place, with the country’s rulers continuing to block access to the internet [at least as the rest of the world knows it] for almost all everyday citizens.
According to the latest data, Burundi is the only other country where more than 90 percent of the population remains offline, but a total of nine countries still suffer from internet adoption rates below 20 percent, and a tenth country – Eritrea – only just reaches that threshold.
More broadly, a total of 50 countries and territories are yet to reach majority internet use, and adoption rates remain below 50 percent across many of the world’s lower income countries.
Indeed, around the world, a total of nearly 2.17 billion people remain offline at the time of writing.
For perspective, just ten countries are home to more than half of the world’s unconnected, with offline populations exceeding 100 million people in five of those nations.
Southern Asia is home to roughly 1 in 3 of the world’s offline individuals, and more than 660 million of the world’s “unconnected” live across the Indian subcontinent alone.
China still ranks third overall, with 120 million people in the country still offline, but reports from CNNIC indicate that well over 90 percent of China’s population now qualifies for the ITU’s “individuals using the internet” metric.
Causes of low internet adoption
But why are so many people still offline?
Well, for initial comparison, the latest World Development Indicators data from the World Bank shows that:
91.6 percent of the global population has access to electricity
91.5 percent has access to basic drinking water services
82.2 percent uses at least basic sanitation services (i.e. toilets) that they do not share with other households.
In other words, universal access remains elusive even when it comes to fundamentals like drinking water, sanitation, and power.
Moreover, increasing internet adoption isn’t simply dependent on improving technical infrastructure.
In its Global Connectivity Report 2025, the ITU explains that:
“There are persistent connectivity divides that reflect broader socioeconomic inequalities. Analysis of barriers to adoption shows that the three most consistently cited reasons for not using the Internet are the lack of need, lack of skills, and high cost of service.”
Literacy is a core barrier
When it comes to lack of skills, literacy remains a primary consideration, especially across countries in Africa and Southern Asia.
At a regional level, literacy rates now exceed 50 percent all around the world, but adult literacy still falls below the 50 percent mark in a total of nine countries.
Of these, data suggests that South Sudan has the world’s lowest literacy rate, but the latest available data are from 2008, so reported figures may not be representative of current realities.
However, the World Bank offers more recent data for other countries in this list, and it’s worth highlighting that current average literacy rates fall below 40 percent in Chad, Mali, Niger, and Afghanistan.
Moreover, in each of those countries, female literacy significantly lags male literacy, and even compared with South Sudan, Chad sees the lowest levels of female literacy in the world, with barely 18.6 percent of women aged 15+ able to read or write at the most basic level.
For added perspective, female literacy still falls below 50 percent in a total of 20 countries.
Rising device prices are cause for concern
Meanwhile, the “high cost of service” referenced by the ITU involves two distinct challenges: the price of devices, and the cost of data.
Device affordability appears to be the primary consideration, and the ITU reports that 68 percent of unconnected adults in low-income countries cite this as the main reason for not owning a mobile phone.
Encouragingly, the ITU’s research found that device affordability improved between 2022 and 2025, but recent spikes in the cost of core components as a result of the AI boom could quickly reverse this trend, pushing internet-capable devices further beyond the reach for millions of people who remain offline.
Indeed, research indicates that the price of new smartphone models has jumped by roughly 25 percent over the past year.
Data costs remain prohibitive for many
Meanwhile, the ITU reports that a mobile plan offering at least 5GB of data per month – the threshold for “meaningful” connectivity – costs more than 10 percent of monthly GNI per capita (i.e. average monthly income) in 15 countries.
For comparison, if prices in the United States equated to 10 percent of monthly GNI per capita, 5GB of mobile data would cost somewhere in the region of USD $8,880, which is more than 44 times greater than the amount that the typical US household spends on gasoline.
Challenges relating to the cost of data are most extreme in the Central African Republic, where the ITU reports that the cheapest 5GB monthly plan costs more than half of the monthly average income.
At that level, it becomes easier to understand why fewer than 1 in 7 people in the country uses the internet today.
Prices are restrictively high in Cuba and Burundi too, with the ITU’s data suggesting that meaningful internet connectivity costs more than a quarter of the national average monthly income in both countries.
The role of demographics in internet access
Population demographics are also a key consideration when it comes to understanding lower levels of internet connectivity.
For example, in eighteen of the world’s twenty least connected countries, more than half of the population is below the age of 20.
It’s important to stress that the ITU’s research finds that 82 percent of global “youth” aged 15 to 24 use the Internet today, which is well above the overall average.
However, younger age groups likely face heightened challenges when it comes to affording connected devices and data plans, and this has particular significance across low and middle-income economies.
But age plays a role at the other end of the spectrum too, with the ITU reporting that older people – especially those aged 75 and above – are often the least connected.
The digital gender gap
Gender is another important factor too, as the ITU asserts:
“A gender divide persists. The gap is most significant in low and lower-middle-income countries, especially in Africa and South Asia, where women are far less likely to be online.”
GSMA Intelligence’s research echoes these findings, with the organisation’s State of Mobile Internet Connectivity 2026 report finding that women account for 58 percent of the adult connectivity gap in low and middle-income countries.
We continue to see similar trends in social media user data too, with the audience reach data published by the world’s largest platforms continuing to show meaningful gender disparity in many parts of the world.
It’s important to highlight that our analysis reveals regular, meaningful anomalies in these datasets, and there’s a good chance that the gender profiles apparent in social media ad reach data are skewed by “bot” accounts.
However, even if we allow for such distortions, differences in overall access to the internet still appear to be the primary driver of differences in the use of social media by gender.
Location matters
And the divide between urban and rural connectivity remains substantial too.
Recent research published by the ITU indicates that the vast majority of the world’s urban residents – 85 percent – uses the internet today, but that figure falls to just 58 percent amongst rural populations.
Moreover, in low-income countries, barely 14 percent of rural residents are online today, with that adoption rate roughly three times lower than the equivalent urban rate.
Beyond adoption figures
But adoption figures alone don’t tell the whole story.
For initial context, data shows that once people start using the internet, it quickly becomes an integral part of their life.
As the ITU states in its Global Connectivity Report 2025,
“For those who are online, frequency is high, with the internet having become a routine part of daily life for most users.”
However, the same report goes on to stress that challenges don’t end when someone gains access to the internet:
“Despite enormous progress in connecting the world, the connectivity challenge is arguably greater than ever. Connectivity must be not only universal but also meaningful and sustainable. Ensuring that it becomes a force for good requires a holistic strategy guided by the [Universal and Meaningful Connectivity] framework, supported by sustained international cooperation and reliable data.”
As a result, while internet adoption figures are an essential component of understanding connectivity, it’s also important to look beyond these metrics.
For readers who’d like to dig deeper, I strongly recommend both the ITU’s Global Connectivity Report 2025, and GSMA Intelligence’s State of Mobile Internet Connectivity 2026 report.
Why people use the internet
But once people are able to access the internet, what do they do when they go online, and where do they go to do it?
Well, interestingly, the answer to that question has evolved more quickly over the past couple of years than it has at any other time during the 15 years that I’ve been producing these reports.
However, some things haven't changed.
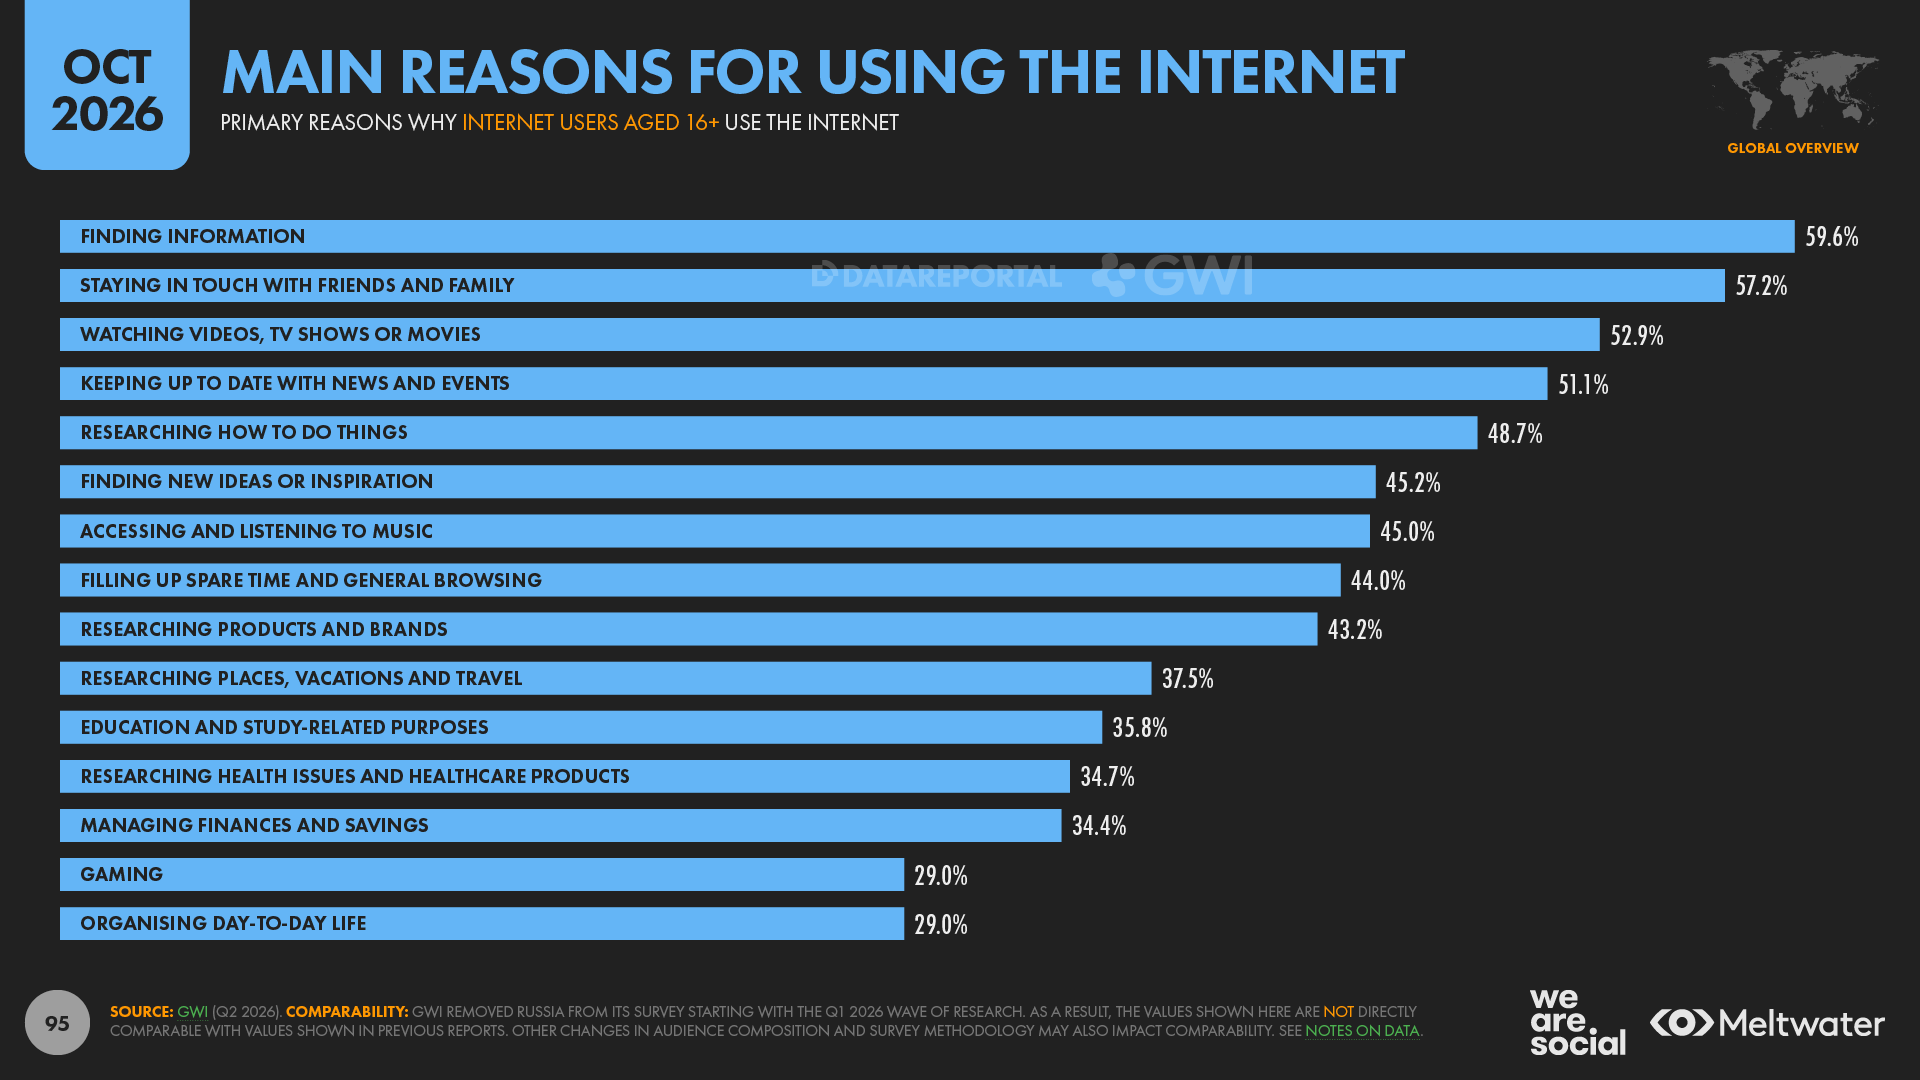
GWI’s latest research shows that “finding information” remains the top reason why people go online today, with just under 6 in 10 online adults across 53 of the world’s largest economies citing this as a primary motivation for using the internet.
For comparison, when this question first appeared in GWI’s survey back in Q3 2018, 67.4 percent of respondents selected this answer option.
And while it’s important to note that the survey’s coverage has expanded meaningfully since then, it’s still interesting to note that – relatively speaking – roughly 14 percent fewer people chose that answer option in Q2 2026 compared with Q3 2018.
Intriguingly, similar declines seem to have affected all answer options for this question, as we can see in the trend for the average number of options selected by respondents during each wave of research.
These trends don’t necessarily mean that all of these activities have become less important in people’s lives, but it’s still worth keeping that downward pattern in mind as we explore the rest of this article, especially when it comes to why people use AI.
Returning to people’s overall motivations, “staying in touch with friends and family” ranks second with 57.2 percent, while “watching videos, TV shows or movies” ranks third, with 52.9 percent.
“Keeping up to date with news and events” places fourth, with 51.1 percent of survey respondents selecting this answer, while “researching how to do things” rounds out the top five, with 48.7 percent.
Interestingly, the same five motivations also topped the rankings in Q3 2018, but their respective order looked a little different back then.
For example, “keeping up to date with news and events” was the second top answer eight years ago, with 59.7 percent of respondents citing this as a primary motivation for going online.
Since then, “staying in touch with friends and family” and “watching videos, TV shows or movies” have both overtaken news-related activities, a finding that echoes the trend of declining news engagement that the Reuters Institute (RISJ) highlighted in its most recent Digital News report.
The RISJ reports that – across its 46 survey countries – the percentage of people who say that they are either “extremely” or “very interested” in the news has fallen from 59 percent at the height of the Covid-19 pandemic in 2021, to just under 46 percent in 2026.
And that 13 percentage-point drop equates to a relative 22 percent decline in the number of people who express an elevated interest in news.
There’s more to news-related trends than these figures alone reveal though, as we explore in our accompanying Digital 2027 analysis of trends in use of the world wide web.
Top online destinations
But in something of a flip to people’s stated motivations for using the internet, social networks and messaging platforms top the rankings of online destinations, while search engines only rank third.
However, when we consider that people use social media platforms for a variety of information and research-related activities – as well as staying in touch with friends and family – those relative rank positions make more sense.
Nearly 19 out of every 20 online adults – 94.5 percent – say that they use social networks like Facebook and LinkedIn each month, which is marginally higher than the figure we reported for these destinations this time last year.
Chat and messaging services like WhatsApp and Telegram rank second, with 94.1 percent of internet users aged 16 above saying that they used one of these platforms during the past 30 days.
Search engines and web portals like Google and Yahoo rank third, with just over 4 in 5 survey respondents – 80.3 percent – selecting this answer option.
Email services rank fourth, with more than three quarters – 76.4 percent – of online adults using at least one email service during the past month.
And ecommerce destinations complete the top five, with 75.9 percent of online adults saying that they’ve used a shopping, auction, or online classifieds platform within the past 30 days.
AI tools do not currently feature in the answer options for this particular question in GWI’s survey, but a separate question indicates that 85.2 percent of online adults used some form of AI tool within the past month, and that figure would rank these tools third in the current dataset, ahead of search engines and portals.
Trends in perspective
It’s imperative to highlight that these findings tell a markedly different story to media headlines.
Yes, the rise of AI is a critically important trend, especially when we consider that the use of generative AI tools (GenAI) has grown exponentially over the past couple of years [more on that in our accompanying Digital 2027 AI analysis].
However, despite the fact that billions of people have already embraced AI tools, it’s important to remember that everyday people aren’t spending all of their time obsessing about AI or “agentic”.
Indeed, the data that we’ve explored in this article reveals that people are still considerably more likely to prioritise social media over AI, even if AI has already earned a valuable place in their daily routines.
And furthermore, despite the rise of AI, search engines still play an essential role in everyday life, even if that relationship is becoming ever more complex.
So, don’t let media hyperbole distract you: much as trends and innovation are important, people’s online behaviours still encompass a wide range of activities, distributed across a broad “portfolio” of devices and online destinations.
And moreover, people’s behaviours and motivations change far more slowly than the media would have you believe, precisely because those behaviours span an ever evolving mix of channels and activities.
In other words, AI isn’t the only thing that matters in 2027, and it’s still critical to think in terms of a “digital mix” – albeit a mix that includes AI.
If you’d like help making sense of that mix, be sure to check out the 900 pages and 10,000+ words of analysis in our complete Digital 2027 Global Overview Report, as well as our full suite of Digital 2027 analyses and reports.
Disclosure: Simon Kemp is a brand ambassador for GWI.
Click here to see all of Simon’s articles, read his bio, and connect with him on social media.