
Digital 2027: The Steady Decline of the World Wide Web
Digital is going through a period of profound change.
Various data sources indicate that global use of the web is declining, as other connected activities claim an ever greater share of people’s online time.
However, this isn’t just a story about AI.
The ebb of the web
The world’s first website went live to the public just over 35 years ago, on August 6th, 1991, and British scientist Tim Berners-Lee made his WorldWideWeb browser available to the public later that same month.
Since then, the web has become a daily fixture for most of the world’s population, with billions of people now visiting websites every single day.
However, DataReportal’s analysis indicates that web activity has been falling for some time, and this trend has important implications for everyone.
To make sense of those implications, this article explores evolving web behaviours in detail, and analyses their potential impact.
Definitions
In this article, whenever we refer to “use of the web”, we specifically mean the use of a web browser on any device to access any kind of content published to publicly accessible websites.
Initial context: internet adoption
Manochi’s latest detailed study of global internet use indicates that 6.15 billion people were using the internet at the start of October 2026, with that figure equal to 73.9 percent of the world’s total population.
Internet user numbers have grown by more than 10 percent over the past three years, but more than 2 billion people remain offline at the time of writing, and the varying quality of internet access remains another important consideration.
For additional data on internet adoption and usage trends, please see our accompanying Digital 2027 Deep Dive article.
World wide web user numbers
Before we start exploring trends in web behaviours, it may be worth spending a moment to quantify the global web user base.
But despite its apparent ubiquity in our lives, it’s surprisingly challenging to put an exact figure on the number of individuals who use the “world wide web”, largely because many people (and many reports) conflate internet access with use of the web.
For initial context, the latest data from Similarweb indicates that there were more than 3.3 billion unique visitors to the world’s 100 most visited web domains in September 2026.
However, this particular figure likely under-represents web activity by users in China, because the country’s “Great Firewall” restricts access to many of the world’s most popular web domains.
It’s important to acknowledge that China’s internet behaviours often differ markedly from those we see elsewhere in the world – especially when it comes to the role played by superapps like WeChat – but with CNNIC reporting 4.38 million websites registered in China, it’s reasonable to assume that the country still sees extensive use of the web.
Web browser users
Meanwhile, Similarweb’s App Intelligence dataset indicates that Google’s mobile Chrome browser has roughly 2.7 billion unique monthly active users (MAUs) outside of China, based on apps available in the Google Play and Apple iOS app stores.
Apple’s Safari browser comes pre-installed on iPhones, so Similarweb is unable to track activity for that particular app, but separate data from Statcounter suggests that Chrome accounted for 66.8 percent of mobile web traffic in July 2026, while Safari accounted for 25.4 percent, and other browser brands took the remaining 7.8 percent for that month.
If we assume that those traffic figures are broadly representative of mobile web user numbers, and then apply them to Chrome’s mobile MAU figure, this data points to more than 4 billion monthly active mobile web users outside of China.
Use of web browsers on computers
Some internet users still only access the web via laptop and desktop computers though, so overall web user numbers may be even higher.
Once again, it’s remarkably difficult to put an exact figure on the number of worldwide internet users that do not go online via mobile devices, but research conducted by GWI suggests that 96.1 percent of online adults used a mobile device to go online in Q2 2026.
For context, GWI’s “Core” survey only includes respondents aged 16 and above, and it also only covers 53 of the world’s largest economies.
Having said that, those 53 geographies account for roughly 78 percent of the world’s total internet users, but research conducted by GSMA Intelligence indicates that mobile devices tend to dominate internet access in less developed economies.
So, if we apply GWI’s highest figure for mobile internet access – 98.5 percent of online adults, as seen in Indonesia and the Philippines – to internet users living in countries not covered by GWI’s survey, our analysis indicates that more than 160 million people outside of China only access the internet via laptop and desktop computers.
That figure is for overall use of the internet though, and not specifically for use of the web.
However, unlike smartphones, where native apps dominate, the majority of user-facing internet activity on laptops and desktops takes place within web browsers, so it’s reasonable to assume that there are roughly 160 million million “computer-only” web users outside of China.
The web in China
For clarity, GWI’s survey does actually cover China, but given the multi-device data we’ll explore below, we’ve separated GWI’s China data from the analysis we conducted above.
CNNIC no longer offers specific figures for the use of web browsers, but it does report the number of people using a search engine, and if we assume that the vast majority of people who use search engines are looking for some form of web content, we should be able to use this figure as a representative proxy.
The organisation’s 57th Statistical Report (in Mandarin) reveals that more than 780 million people in China used a search engine in December 2025, so we’ll use this as our figure for Chinese web users accessing via any device.
Global web users
And if we add these various figures together, Manochi’s estimate for global web users comes to just over 5 billion.
For perspective, that figure indicates that 81.5 percent of the world’s 6.15 billion internet users access online content via the world wide web today.
Interestingly, Similarweb’s data for the world’s top 100 websites indicates that unique web users have actually increased over the past year, with the company’s analysis pointing to annual user growth of 4.5 percent.
However, as we’ll explore in detail below, recent trends in traffic to the world’s top websites have been markedly different to the trends we’ve seen across the rest of the world’s web domains.
And for added perspective, based on the same proxy approach we used above, CNNIC’s data suggests that web users in China have declined by close to 100 million over the past year, potentially because of the rapid rise of the country’s home-grown AI platforms.
Making sense of web trends
User figures alone don’t tell the whole story though, and when we look more closely at users’ web behaviours, a more troubling picture emerges.
To help us make better sense of these trends, Similarweb has provided us with a detailed dataset that profiles how traffic to the world’s top 10,000 websites has evolved since LLMs like ChatGPT become publicly available towards the end of 2022.
For reference, note that the list of domains included in this dataset varies from quarter to quarter, to ensure that we’re always examining the world’s 10,000 most visited domains in each respective period.
And for added context, research conducted by Henrique Xavier in 2024 (also using Similarweb data) concluded that – across more than 350 million active domains – “approximately 50 percent of all web traffic is directed towards roughly 3,000 websites.”
If that finding still holds true, traffic to the world’s 10,000 most visited domains likely accounted for close to 60 percent of total global web traffic in Q2 2026.
In other words, it’s safe to assume that the trends we’ll explore in this analysis are representative of more than half of all the world’s web traffic.
So what does this rich data tell us?
Web traffic decimated
Let’s start with an alarming soundbite: across the world’s top 10,000 web domains, total monthly web traffic has declined by more than 10 percent since ChatGPT launched to the public in November 2022.
However, it’s important to stress that the rise of LLMs isn’t the only potential reason why web traffic is in decline, and in fact, Manochi’s analysis suggests that people’s increasing use of native mobile apps is more likely the primary reason why web traffic has fallen so much over recent years [more on that later].
And for added perspective, Similarweb’s data shows that there was actually a brief resurgence in global web traffic during the second half of 2024.
Total web visits started to decline again at the start of 2025 though, and figures show that traffic is now roughly 6.8 percent lower than it was this time two years ago.
To help make sense of that figure, it’s worth considering that combined traffic across the top 10,000 web domains fell by almost 50 billion visits per month between Q4 2022 and Q2 2026.
So, while it’s important to monitor short-term fluctuations, data confirms that web use is in decline.
Decreasing web time
But the time that the world spends using the web has fallen even faster than visitor numbers, and Similarweb’s data reveals an 11.2 percent decline in the total time spent visiting the world’s top 10,000 domains over the past 24 months.
To put that figure in perspective, the total time spent across the top 10,000 websites has fallen by more than 6.6 billion hours per month in just two years, which equates to the loss of roughly 760,000 years of cumulative web time each month.
Moreover, total web time has declined by close to 16 percent since ChatGPT’s launch at the end of 2022.
Meanwhile, this decline in total time spent has been exacerbated by a shortening of average visit times.
As you might expect, visit durations vary significantly between websites, but if we look at overall averages across all of the 10,000 domains in our Similarweb dataset, we can see that average session time has fallen by roughly 5 percent over the past two years.
More specifically, during the second quarter of 2024, the typical web visit lasted just under 8 minutes.
However, by the second quarter of 2026, that average had fallen to just over 7½ minutes, resulting in a reduction of close to 30 seconds per visit in just two years.
Page views counter the trend
But in a somewhat surprising contrast to these trends, the total number of web pages viewed each month has actually increased over the past 24 months.
Similarweb’s data indicates that web users loaded an average of just under 3 trillion pages per month across the world’s top 10,000 domains in the second quarter of 2026, with that figure up by more than 2 percent compared with the same period in 2024.
Moreover, the average number of pages viewed per individual web visit has increased over recent months too, with the current average of 7.18 pages per visit representing an increase of close to 10 percent compared with Q2 2024, when the average stood at 6.54.
And it’s also interesting to note that average page figures saw a meaningful increase at the start of 2025, despite that being the period during which we saw a return to declines in overall web visits.
Digging deeper: web share by device
Looking more closely at trends by device, the data provide support for the hypothesis that the rise of native mobile apps continues to play a primary role in evolving web activity.
Similarweb’s figures show that total desktop visits actually fell by less than 1 percent over the past two years, compared with an 11 percent drop in visit figures for mobile traffic during that same period.
Moreover, absolute desktop visits have actually increased over the past 12 months
As a result of these diverging trends, desktop’s share of overall web traffic has been creeping back up over recent months, but – with a 57.5 percent share – mobile devices still account for the majority of the world’s web traffic.
And these figures point to one of the most interesting findings in this study: many of the recent declines we’ve seen in web activity appear to be directly related to changes in web activity on mobile phones, most likely due to an increasing preference for native mobile apps.
A consistent story
Turning to other sources, we see a similar story in Statcounter’s data too, albeit with different numbers and trends.
For context, Statcounter’s dataset references the number of web pages served across a very different sample of websites compared with the Similarweb dataset we’ve explored so far, and Statcounter’s reporting also includes some additional devices (tablets and consoles).
At this point, it’s important to stress that Statcounter’s data often reveals sizeable movements in device share from month to month, and there’s often no obvious reason for these changes.
However, the company’s data alludes to a steady decline in mobile’s share of global web traffic over recent months.
According to Statcounter’s intelligence, mobile’s share of web traffic appears to have peaked in June 2025, when it reached 63.11 percent.
The data then shows a marked drop in the following month though, with mobile’s share dropping to 58.34 percent in July 2025.
Since then, we’ve seen relatively volatile figures, but – on a relative basis – the July 2026 figure of 52.59 percent is roughly 16.7 percent lower than the peak figure we saw in June 2025.
Statcounter’s interim data for September 2026 suggests that mobile’s share may have rebounded somewhat since July, but the company stresses that these figures should not be considered final until at least 45 days after the end of the respective month, and we’ve seen meaningful adjustments to Statcounter’s interim data in the past.
Device trends by country
It’s also important to highlight that Statcounter’s data reveals meaningful differences in device behaviours by geography.
For example, the company’s figures indicate that mobile phones accounted for more than three quarters (75.59 percent) of web traffic from Egypt in July 2026, compared to just one quarter (26.15 percent) of web traffic from Russia.
There doesn’t appear to be any obvious pattern within these geographical differences either, and none of the most obvious candidates – levels of economic development, median age of the population, and language considerations – offer any clear correlation.
Mobile browser activity
In order to make sense of mobile web trends, it’s worth distinguishing between activity within “standalone” browser apps like Google Chrome Mobile and Safari for iOS, and “embedded” browsing, where other apps (e.g. Facebook) load web pages within their own, integrated browsing environment.
When exploring the decline in mobile web traffic, one of my initial hypotheses was that there might have been a shift in the balance between “intentional” web use in standalone apps, and more “spontaneous” activity in embedded browsers.
Apple’s mobile operating system (iOS) obfuscates data from embedded, Safari-based browsers, so it’s difficult to determine the split between standalone and embedded web activity on iPhones.
However, Radar data from Cloudflare indicates that, over a twelve-month period ending in early October 2026, standalone browser apps accounted for an average of just under three quarters – 72.9 percent – of mobile web traffic that likely originated from “authentic human activity” on Android phones.
That in turn indicates that slightly more than 1 in 4 mobile web visits on Android devices originated from an embedded browser.
It’s important to highlight that this data only reflects traffic to websites that use Cloudflare, but the company itself claims that it “powers 20 percent of the web”, and analysis by W3Techs suggests that the company’s share may even be closer to 25 to 30 percent.
Looking more closely, Cloudflare’s Radar data reveals that 25 percent of total Android web traffic can be attributed to WebView, which is the standard Android functionality employed by non-browser apps to deliver embedded browsing.
However, it’s interesting to note that Instagram’s in-app browser – which Meta developed itself – accounted for 1.66 percent of all Android web traffic over the past 12 months, which is somewhat surprising given the platform’s notoriously limited hyperlinking options.
Meanwhile, Facebook’s in-app browser accounted for 0.37 percent of worldwide Android web traffic over the past year, meaning that these two Meta apps accounted for just over 2 percent of global Android web traffic.
But what does this data tell us about how behaviours have evolved?
A change in focus
Well, based on Cloudflare’s figures, there does appear to have been a change in the balance between standalone and embedded browser traffic over the past year.
This time last year, in the first week of October 2025, standalone browser apps accounted for 73.9 percent of worldwide Android web traffic that Cloudflare classified as “likely human” (i.e. after removing bot traffic).
One year later, in the first week of October 2026, the equivalent figure was 71.9 percent.
As we’ve seen in other datasets, there are noticeable fluctuations between individual periods within this data, but – overall – the general trend is a gradual shift away from standalone browser apps, and towards embedded browser activity.
More specifically, that two percentage-point shift equates to a relative 2.7 percent decline in standalone browsers’ share of mobile web traffic over the past year.
During that same period, Similarweb’s data indicates that total mobile web traffic (not just Android) has declined by 3.6 percent.
And Similarweb’s App Intelligence data provides another valuable perspective here, indicating that monthly active users of Google’s Chrome app have declined steadily over the past three years.
Having said that, Similarweb’s data also shows that Chrome’s mobile app users have rebounded over recent months, and the app’s latest MAU figure is actually higher than the equivalent figure for this time last year.
However, if we consider the overall decline in mobile web traffic together with the longer-term decline in the use of standalone browser apps, my hypothesis is that people’s mobile web activity is becoming steadily less intentional.
And one of the consequences of this shift away from intentional web activity is an increasing concentration of traffic to an ever smaller number of web domains.
The concentration of web influence
One of the most important findings in this dataset is an apparent “oligopolisation” of the web, where a handful of top players are capturing an ever greater share of the world’s web activity.
For context, Similarweb’s data reveals that a total of 31 sites attracted an average of more than 1 billion monthly visits during Q2 2026.
Just two years ago, in Q2 2024, 34 sites reached this threshold.
Admittedly, a drop of 3 sites doesn’t sound like much in absolute terms, but on a relative basis, that means 10 percent fewer sites attract 1 billion or more visits today than did this time two years ago.
And the trend towards consolidation becomes considerably clearer if we turn our attention to sites that attract at least 10 million visits per month.
Similarweb’s data shows that fewer than 5,000 domains reached that particular threshold in Q2 2026, down from more than 6,000 just two years earlier.
And for perspective, the drop of 1,114 domains achieving this monthly benchmark represents a relative decline of 18.3 percent in just 24 months.
Survival of the biggest
Conversely, combined monthly traffic across the top 20 domains in each quarter has actually held relatively steady since the last quarter of 2022, when ChatGPT launched to the public.
And in fact, monthly average traffic across the top 20 domains in the second quarter of 2026 was slightly higher (+0.8 percent) than the equivalent figure for the last quarter of 2022.
However, combined traffic across rank positions 1 to 5,000 fell by 9.3 percent during that same period, while traffic across positions 5,001 to 10,000 dropped by 22.9 percent.
These figures indicate that the world’s most popular websites have managed to maintain their appeal, even as overall web activity has been declining.
As a result, the world’s top 20 domains now account for a hefty 44.1 percent of traffic across the top 10,000 domains, with that share up by a relative 11.9 percent (+4.8 percentage points) compared with the 39.4 percent share that the top 20 domains claimed in Q4 2022.
Share of web traffic by site rank
Here’s how traffic to the world’s top 10,000 web domains split across domain ranks in the second quarter of 2026:
Top 1 domain (google.com): 20.9 percent of the 10,000-domain total
Top 10 domains: 38.5 percent of the 10,000-domain total
Top 20 domains: 44.1 percent of the 10,000-domain total
Top 50 domains: 48.3 percent of the 10,000-domain total
Top 100 domains: 55.8 percent of the 10,000-domain total
Top 1,000 domains: 74.2 percent of the 10,000-domain total
Top 5,000 domains: 91.7 percent of the 10,000-domain total
Domains 5,001 to 10,000: 8.3 percent of the 10,000-domain total
And as we saw earlier, research conducted by Henrique Xavier in 2024 concluded that “approximately 50 percent of all web traffic is directed towards roughly 3,000 websites.”
Put another way, Xavier’s research indicates that the top 0.00085 percent of all web domains claim half of total global web traffic.
In his paper, Xavier asserts that this degree of concentration is “remarkably high”, with his analysis identifying a Gini coefficient of 97 percent, where 100 percent would have been the maximum possible value.
Google’s increasing dominance
Returning to our own Similarweb dataset, it’s particularly interesting to see that the world’s number one most visited domain – google.com – attracted more traffic in Q2 2026 than the combined traffic across rank positions 1,627 to 10,000.
And furthermore, Google’s share of traffic has actually increased over the past few years, from 18.56 percent of the top 10,000 in Q4 2022, to 20.91 percent in Q2 2026.
It’s important to highlight that people visit google.com for a wide variety of activities, with subdomains such as mail.google.com, docs.google.com, and gemini.google.com all enjoying impressive traffic in their own right.
However, Similarweb’s data shows that Google’s root domain, “www.google.com”, currently accounts for just under 70 percent of visits to Google’s website.
And with the page layout at www.google.com currently dominated by the platform’s search bar, it seems reasonable to conclude that Google Search still lies at the heart of Google’s overall success.
But how has search traffic evolved over recent years?
The evolution of search
Similarweb’s data indicates that search engines accounted for 23.85 percent of total visits across the world’s top 10,000 domains in Q2 2026, or just under 1 in every 4 visits.
Amongst those top 10,000 domains, Similarweb classified 93 sites as “search engines”, with two of these domains overtly Google Search [note: Google has been transitioning almost all of its geospecific domains (e.g. google.de) to google.com, and Similarweb’s data suggests that only google.com.hk now remains as a functioning “local” domain].
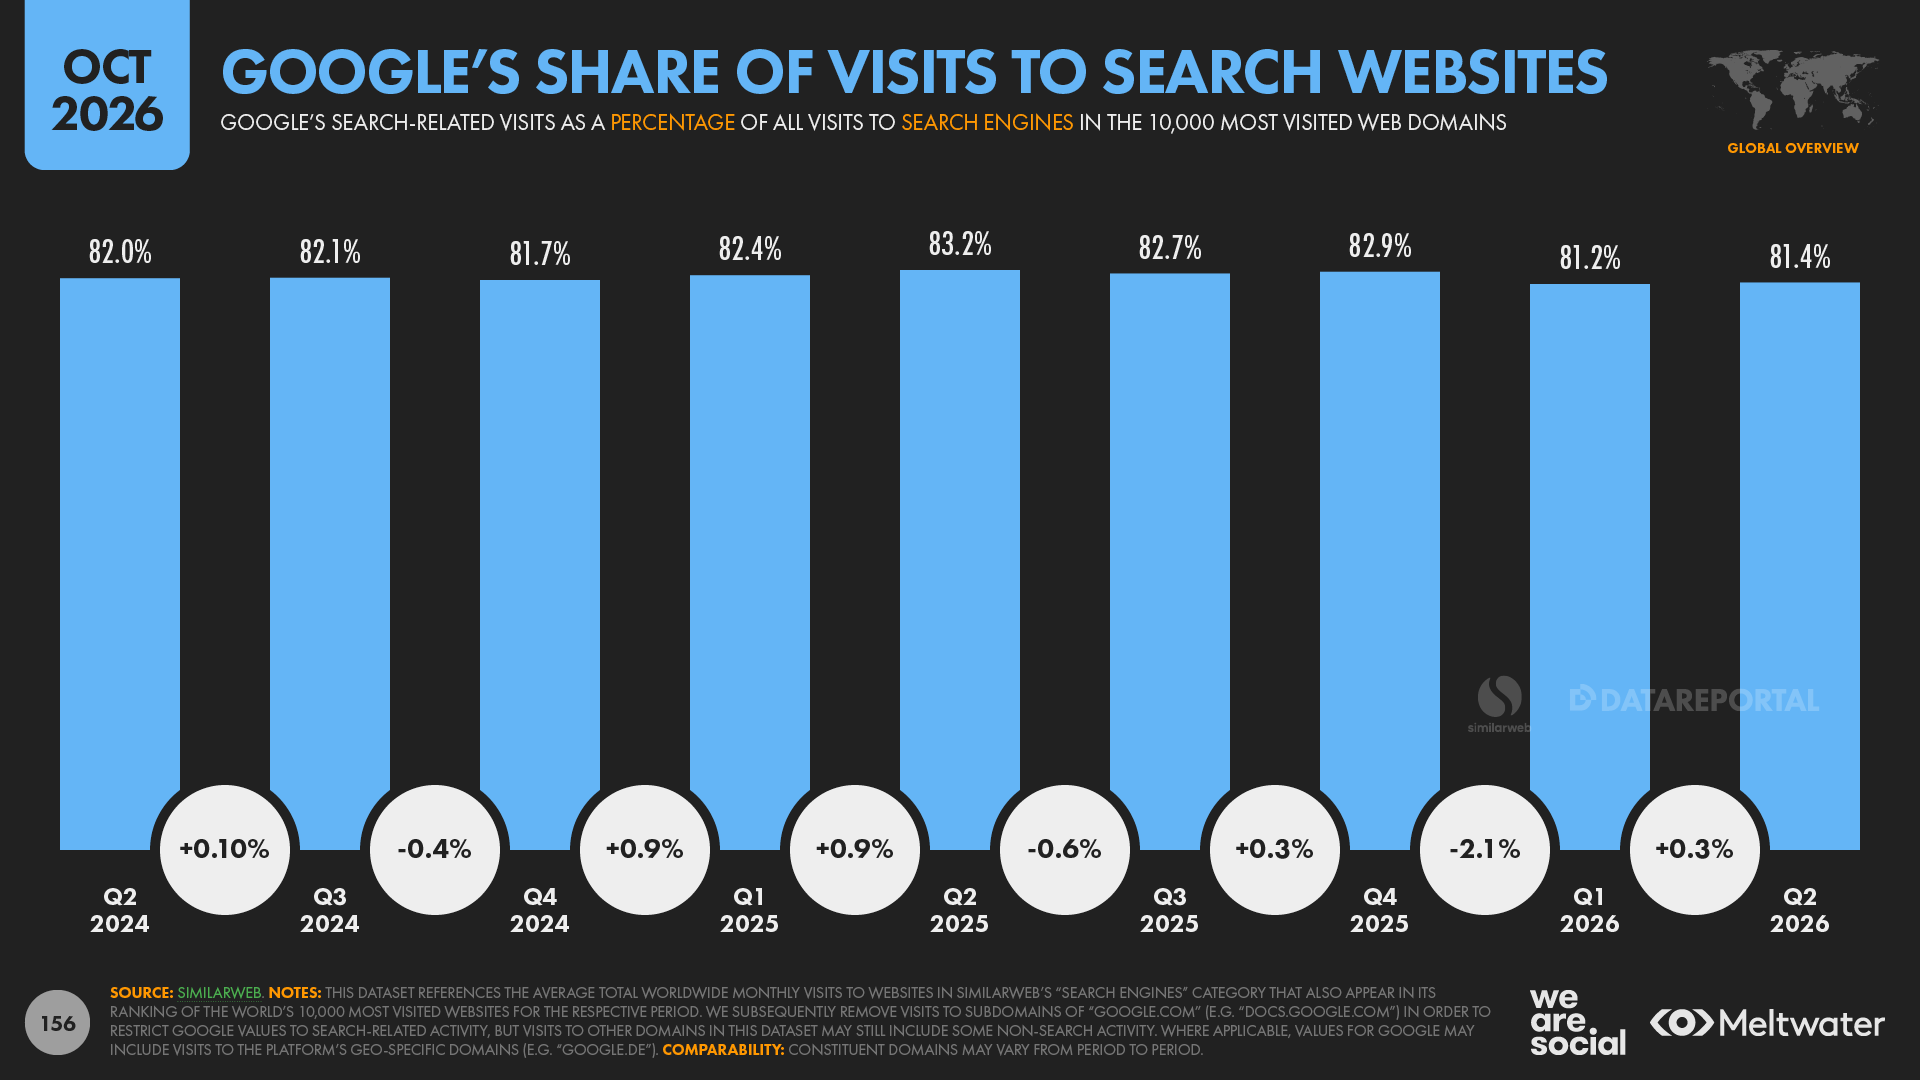
Once we remove visits to Google subdomains like mail.google.com and docs.google.com from the site’s overall traffic, Manochi’s analysis indicates that these two Google search domains accounted for roughly 81.4 percent of all search-focused visits to search engine sites in the top 10,000 domains between April and June 2026.
And interestingly, Google’s share of category visits has remained relatively consistent over the past three years too, with that latest value just one tenth of a percentage point lower than the value for Q3 2023, which is as far back in the data as we can go for this particular metric.
But if we broaden our focus to the search category as a whole, Manochi’s analysis indicates that total search-oriented visits to search engine sites that rank amongst Similarweb’s top 10,000 domains have fallen by 4.3 percent over the past two years.
And while that relative decline may sound quite small, it’s worth highlighting that this translates to the loss of roughly 3.3 billion monthly visits to search engines between Q2 2024 and Q2 2026.
As we saw earlier though, total visits across all web categories have fallen by more than 10 percent during that same period, so – while these declines are still cause for meaningful concern – it’s worth highlighting that search traffic has been eroding considerably more slowly than web traffic overall.
Other findings echo this trend
Surveys corroborate Similarweb’s data too, with GWI’s regular research revealing a steady decrease in the share of online adults who say that they visit search engines.
In the company’s most recent release – Q2 2026 – 80.3 percent of worldwide internet users aged 16 and above said that they’d used a search engine within the previous 30 days, which in relative terms is 3 percent lower than the 82.8 percent of respondents that answered in the affirmative in Q2 2024.
These findings are somewhat diluted by behaviours in China though, where significantly fewer internet users report using search engines compared with the global average.
And if we remove China from this dataset, the overall average for Q2 2026 jumps to 86.4 percent.
That’s still 1.3 percentage points lower than the equivalent 87.7 percent we saw in Q2 2024 though, which points to a relative drop of 1.5 percent in just 2 years.
But in contrast to misrepresentations in the mainstream media, it’s interesting to note that younger internet users are more likely to use search engines than their parents are.
Indeed, with the exception of retirees, GWI’s data indicates that internet users aged 16 to 24 are the most likely to use search engines today.
And furthermore, the use of search engines amongst younger cohorts is declining more slowly than it is for any other generation, except for internet users over the age of 65.
However, regardless of these differences in pace, the use of search engines is still declining across all demographics.
And this trend doesn’t just affect search platforms either; despite the rise of zero-click results, search engines are still a primary gateway to third-party content, so any decline in search activity will have clear consequences for the rest of the web too.
Given how important online search is to various aspects of the online landscape, we explore broader trends in the contextual use of search engines in our flagship Digital 2027 analysis.
But if search is falling more slowly than the average, where is traffic falling more quickly?
Most significant web declines
Manochi’s analysis indicates that three of the top-level website categories in our Similarweb dataset have seen traffic decline by more than 30 percent over the past four years:
News and Media: a decline of 36.1 percent
Health: a decline of 34.5 percent
Reference Materials: a decline of 33.2 percent
For balance, it’s important to highlight that several categories have seen marked increases in web traffic during that same time period, notably:
Travel and Tourism: an increase of 24.9 percent
Law and Government: an increase of 9.2 percent
Vehicles: an increase of 6.7 percent
Business and Consumer Services: an increase of 4.6 percent
And similarly – despite the rise of native mobile apps – some of the world’s most popular social media platforms also saw their web traffic grow since the end of 2022, with instagram.com, tiktok.com, reddit.com, and linkedin.com all seeing double- or even triple-digit growth over the past four years.
However, Similarweb’s data indicates that News and Media is one of the five largest categories of web content, and GWI’s latest survey indicates that “keeping up to date with news and events” remains one of the most commonly cited reasons for using the internet.
So, given that it has also experienced the most rapid traffic decline of any top-level web category, let’s start by exploring News and Media.
News traffic tumbles
Similarweb’s data indicates that News and Media domains were the fourth most visited category amongst the world’s top 10,000 websites in Q2 2026, with the category attracting an average of more than 36 billion visits per month between April and June.
However, that figure has fallen from more than 56 billion visits per month in Q4 2022, resulting in a loss of more than a third of category visits in less than 4 years.
That downward trend continues too, with quarterly figures for the past two years showing a steady decline, albeit with a brief reprieve in Q3 2024.
Indeed, despite that initial “bump”, Similarweb’s data shows that category traffic fell by almost a quarter – 24.3 percent – between Q2 2024 and and Q2 2026.
Looking more closely at news trends
However, survey results from GWI indicate that the number of people saying they use online news websites or mobile apps has declined far more slowly than those web traffic figures suggest.
More specifically, back in Q2 2024, 41.4 percent of GWI’s respondents said that they had visited a news website or used a news app within the past 30 days.
By Q2 2026, that figure had dropped to 40.2 percent, with that 1.2 percentage point decline equating to a relative decrease of 2.9 percent.
Stable interest in news
For valuable context here, it’s worth noting that the share of GWI respondents who express a general interest in news and current affairs has remained relatively stable during that time, although the data does reveal an overall downward trend over the past two years, once we allow for seasonality.
However, internet users aged 65 and above are almost twice as likely as internet users between the ages of 16 and 24 to say that they’re interested in news and current affairs (63.7 percent versus 33.1 percent, respectively).
It’s unclear from this data alone whether this trend represents a generational shift in the value that people place on news, or whether individuals simply become more engaged with current affairs as they get older, but either way, these findings have important implications for businesses and policymakers alike.
News as internet motivation
Meanwhile, the number of online adults who cite “keeping up to date with news and events” as a primary motivation for using the internet has also fallen steadily over recent months, from 54.1 percent in Q2 2024, to 51.1 percent in Q2 2026.
It’s important to note that values for most other motivations in GWI’s survey have also fallen during that time, but news appears to be declining faster than other answer options for this particular survey question.
Indeed, “keeping up to date with news and events” was the second top choice in GWI’s survey eight years ago, with 59.7 percent of respondents citing this as a primary motivation for going online.
In GWI’s most recent survey, this particular motivation ranks fourth.
During the past 8 years, the share of respondents selecting this option has fallen by 14.4 percent, resulting in “staying in touch with friends and family” and “watching videos, TV shows or movies” both becoming more commonly cited motivations for using the internet than “keeping up to date with news and events”.
Corroborating evidence
Meanwhile, research commissioned by the Reuters Institute for the Study of Journalism (RISJ) points to even more precipitous declines.
The RISJ’s Digital News Report shows that the percentage of worldwide respondents who say that they are either “extremely” or “very interested” in the news has fallen from 59 percent at the height of the Covid-19 pandemic in 2021, to just under 46 percent in 2026.
And that 13 percentage-point drop equates to a relative 22 percent decline in the number of people who express an elevated interest in news.
In its comprehensive analysis of the state of digital news in 2026, the RISJ observes that:
“These reductions of popular interest in news have democratic as well as commercial implications, making it harder to engage citizens in the political process as well as increasing the challenge of successfully monetising attention to the news, whether through advertising or by way of reader revenue.”
Tangible financial impact
It’s important to stress that our Similarweb dataset focuses solely on web traffic, and our analysis does not include trends in the use of news outlets’ native mobile apps.
However, when we examine one of the core signals in our Similarweb data, we see clear evidence to support the RISJ’s assertion that monetising attention to the news is becoming increasingly challenging.
Of the 1,168 News and Media domains that ranked amongst the top 10,000 websites in Q2 2026, Similarweb’s data shows that 963 of them used Google AdSense products to place advertising on their sites.
In other words, more than 82 percent of top websites in Similarweb’s news and media category make use of AdSense functionality.
It’s important to highlight that AdSense is only one of the many options available to publishers when it comes to monetising their properties, and furthermore, Similarweb’s data only identifies whether a site uses Adsense – not whether the site features AdSense placements on every page, nor how many such ad units it includes per page where it does use them.
However, for simplicity, and in the knowledge that advertising forms a core revenue stream for many news publishers – even those who have healthy subscription revenues – let’s assume that these publishers include at least one AdSense unit on all pages across their sites.
So how might declines in web traffic affect news publishers’ revenues?
Well, Similarweb’s data indicates that websites in the News and Media category that use AdSense have seen total visits fall by more than 20 percent over the past two years, and by a third since the end of 2022.
However, as we saw earlier, average page views have actually increased over recent months, which helps to mitigate some of these declines.
Trends are still worrying though: News and Media sites that monetise via AdSense have seen total monthly page views fall by 8.4 percent in the past 24 months, and by more than 30 percent since the last quarter of 2022.
For perspective, that last figure indicates that news publishers have seen monetisable web activity fall by more than 40 billion monthly page views in less than four years.
There’s a good chance that some of this activity moved from the same publishers’ websites to their respective native mobile apps, so that figure may not be representative of overall changes in potential ad revenue.
However, if web ad revenues have indeed been reduced by the degree suggested in Similarweb’s data, the prospects for the news industry look bleak.
Indeed, we’ve already seen the number of News and Media websites in Similarweb’s top 10,000 domains ranking fall from 1,377 in Q4 2022, to 1,168 today, with that reduction of 209 individual sites equating to a decrease of more than 15 percent.
Implications of declining news traffic
In their 2026 Digital News Report, the RISJ notes that social and video networks are now the world’s primary source of news, having overtaken both TV and websites or apps.
It’s important to stress that some news outlets have grown significant audiences for their own “channels” on platforms like YouTube, but their success in such environments is dependent on opaque algorithms beyond their control, and they also need to share a meaningful proportion of ad revenue with the platforms.
News outlets have also seen some success in growing followerships on social media, but these channels offer significantly fewer opportunities for news brands to monetise their content.
Moreover, the RISJ’s research indicates that independent influencers and creators account an increasingly important share of news engagement on social media, with more than a quarter of their 2026 survey respondents – 27 percent – saying they encountered news content from such accounts within the past week.
In fairness, some of these individuals could still be considered journalists in the classic sense, and some deliver high-quality, original content that adds significant value to the news landscape.
However, many high-profile news “influencers” merely add their own commentary to content that has been researched and reported by others, offering little or no financial benefit to their original sources.
And the same can be said for the vast majority of news delivered via LLMs too: these platforms have already gained a meaningful place in many people’s news habits, but these channels do little – if anything – to deliver financial support to news brands, journalists, and the news industry overall.
No news is not good news
And therein lies a gravely concerning threat.
If news brands and journalists are unable to generate sufficient income to support their activities, we risk losing a significant proportion of the sources on which we rely for news today.
AI is currently incapable of going out into the physical world and reporting on what’s happening, and as a result, it’s wholly dependent on synthesising the work of others.
Similarly, many social media “influencers” are entirely dependent on the hard work of others to provide the basis for their “news” content, and without that original reporting, such “online personalities” would have little meaningful content to offer.
But this isn’t just about publishers, and we must acknowledge that many of these trends are the direct result of evolving audience choices and behaviours.
Indeed, no one is forcing people to get their news from social media or AI chatbots.
Rather, for whatever reason – whether that’s declining trust in news organisations, paywalls, convenience, or simply apathy and indifference – many people seem to have decided to get their news from intermediated channels instead of from original sources.
But that raises two fundamental questions:
Can original sources survive in an increasingly intermediated news environment?
If they cannot, what happens to our societies when people no longer have access to accurate and balanced news reporting and analysis?
Reference sites
News and Media isn’t the only web category facing such challenges though, and similar issues affect sites in the Reference Materials category.
For initial context, Similarweb’s data reveals that traffic to websites in this category has fallen by roughly a third – 33.2 percent – since the launch of ChatGPT in November 2022.
Similarly, the number of individual domains in this category that rank amongst the world’s top 10,000 websites has fallen by 23 percent during that same period, from 113 in Q4 2022, to just 87 in Q2 2026.
And furthermore, in contrast to some of the trends we explored earlier, even the category’s biggest name has experienced significant declines.
Wikipedia’s woes
Wikipedia.org currently places eleventh in Similarweb’s overall web rankings, and as the only “non-corporate” amongst the Big Tech brands that dominate the top 20, Wikipedia’s performance is a bellwether for the open web at large.
And because of that, trends in Wikipedia’s traffic offer significant cause for concern.
Our current Similarweb dataset shows that total visits to Wikipedia have fallen by more than a quarter – 26.9 percent – since Q4 2022, and they’re down 16.5 percent in the past two years alone.
Moreover, the time spent on Wikipedia has declined even faster, with Similarweb’s analysis suggesting a 32-percent decline in cumulative time spent on the site since the end of 2022.
These findings indicate that many of the trends we explored in our April 2025 analysis continue today, although Similarweb’s data does suggest that the pace of decline has slowed slightly over recent months.
On a slightly more encouraging note, unique user numbers haven’t fallen quite as quickly, but Similarweb’s data shows that the number of unique visitors to wikipedia.org has still declined by 15.4 percent over the past two years.
Various perspectives, similar stories
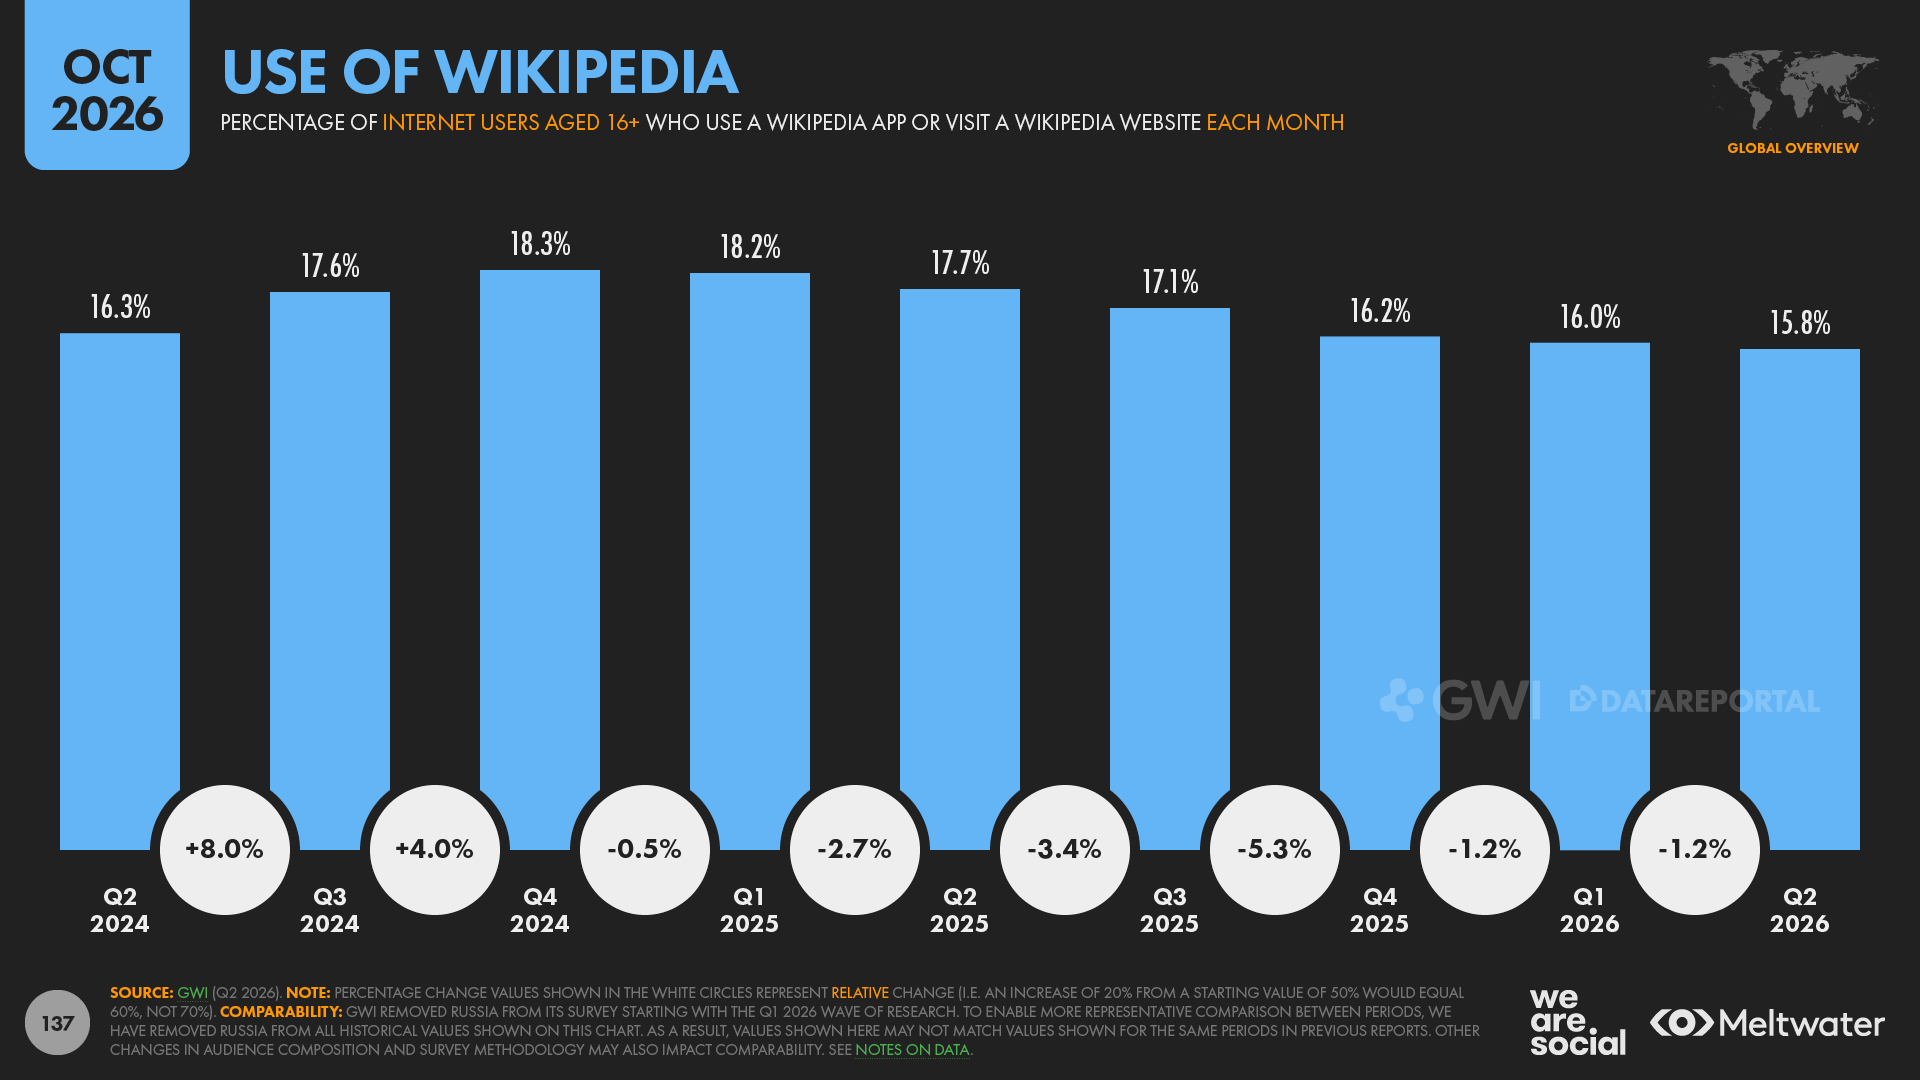
GWI’s data reveals a similar decline in the number of people visiting Wikipedia, with the company’s most recent global survey of more than 235,000 online adults suggesting that Wikipedia users have fallen by roughly 14 percent in just the past 18 months.
More specifically, in Q4 2024, 18.3 percent of GWI’s global respondents said that they’d accessed Wikipedia using either its website or its mobile app within the past 30 days.
By Q2 2026, that figure had fallen to 15.8 percent of online adults, with GWI’s own data quantifying this decline at around 36 million distinct users.
But it’s not just third-party data that reveals such trends.
The Wikimedia Foundation’s own statistics tells the same story, with the organisation’s data pointing to a 15 percent decline in page views over the past 24 months.
For reference, Wikistats data indicates that views fluctuate from month to month, and we’ve seen some temporary recoveries in this data over the past two years.
However, Q2 2026 was the first time in recent memory that we’ve seen quarterly page views fall below 40 billion, with that figure roughly 18 percent lower than the figure reported for Q1 2025.
A vibrant community
But despite these trends, Wikipedia’s volunteer contributors appear to be just as active as ever.
For example, we’ve seen a significant increase in the number of new Wikipedia pages created over recent months, with the value for Q2 2026 roughly 35 percent higher than the equivalent figure for Q2 2024.
And despite some seasonal ups and downs, the number of new Wikipedia user accounts has remained relatively stable over the past couple of years, and the number of registrations in Q2 2026 actually exceeded registrations in Q2 2024.
Content editing activity has also remained relatively firm, and the most recent figure for quarterly edits is the highest we’ve seen for at least two years.
And this last figure is particularly encouraging, because it shows that Wikipedia’s volunteer community remains just as engaged with maintaining existing content as it does with creating new pages.
A darkening outlook
However, despite these encouraging metrics, it’s unclear how long Wikipedia’s contributors will remain engaged if the site’s traffic continues to fall.
That’s obviously worrying for Wikipedia itself, as well as for the hundreds of millions of people who rely on the site for information each month.
But – somewhat ironically – these trends should be of even greater concern for the LLMs that continue to ingest and regurgitate Wikipedia’s content.
More specifically, competitive advantage in AI relies heavily on accessing the most comprehensive and up-to-date training data, and if humans see fewer incentives to update Wikipedia content, today’s most popular LLMs will see a marked degradation in one of their most frequently cited sources.
Separately, web publishers and SEO practitioners may want to consider that ongoing declines in Wikipedia’s traffic and user base have occurred in spite of increases in its contributor activity, and the associated SEO boost that these updates should have delivered to perceived content “freshness”.
Unexpected declines
Wikipedia isn’t the only large site that’s seen meaningful traffic declines though, and – in something of a surprise – we’ve also seen losses across one of the web’s original stalwarts: adult content.
For context, despite numerous governments’ attempts to block these sites, adult content continues to attract a sizeable share of the world’s web activity, and interest remains relatively consistent across countries and cultures.
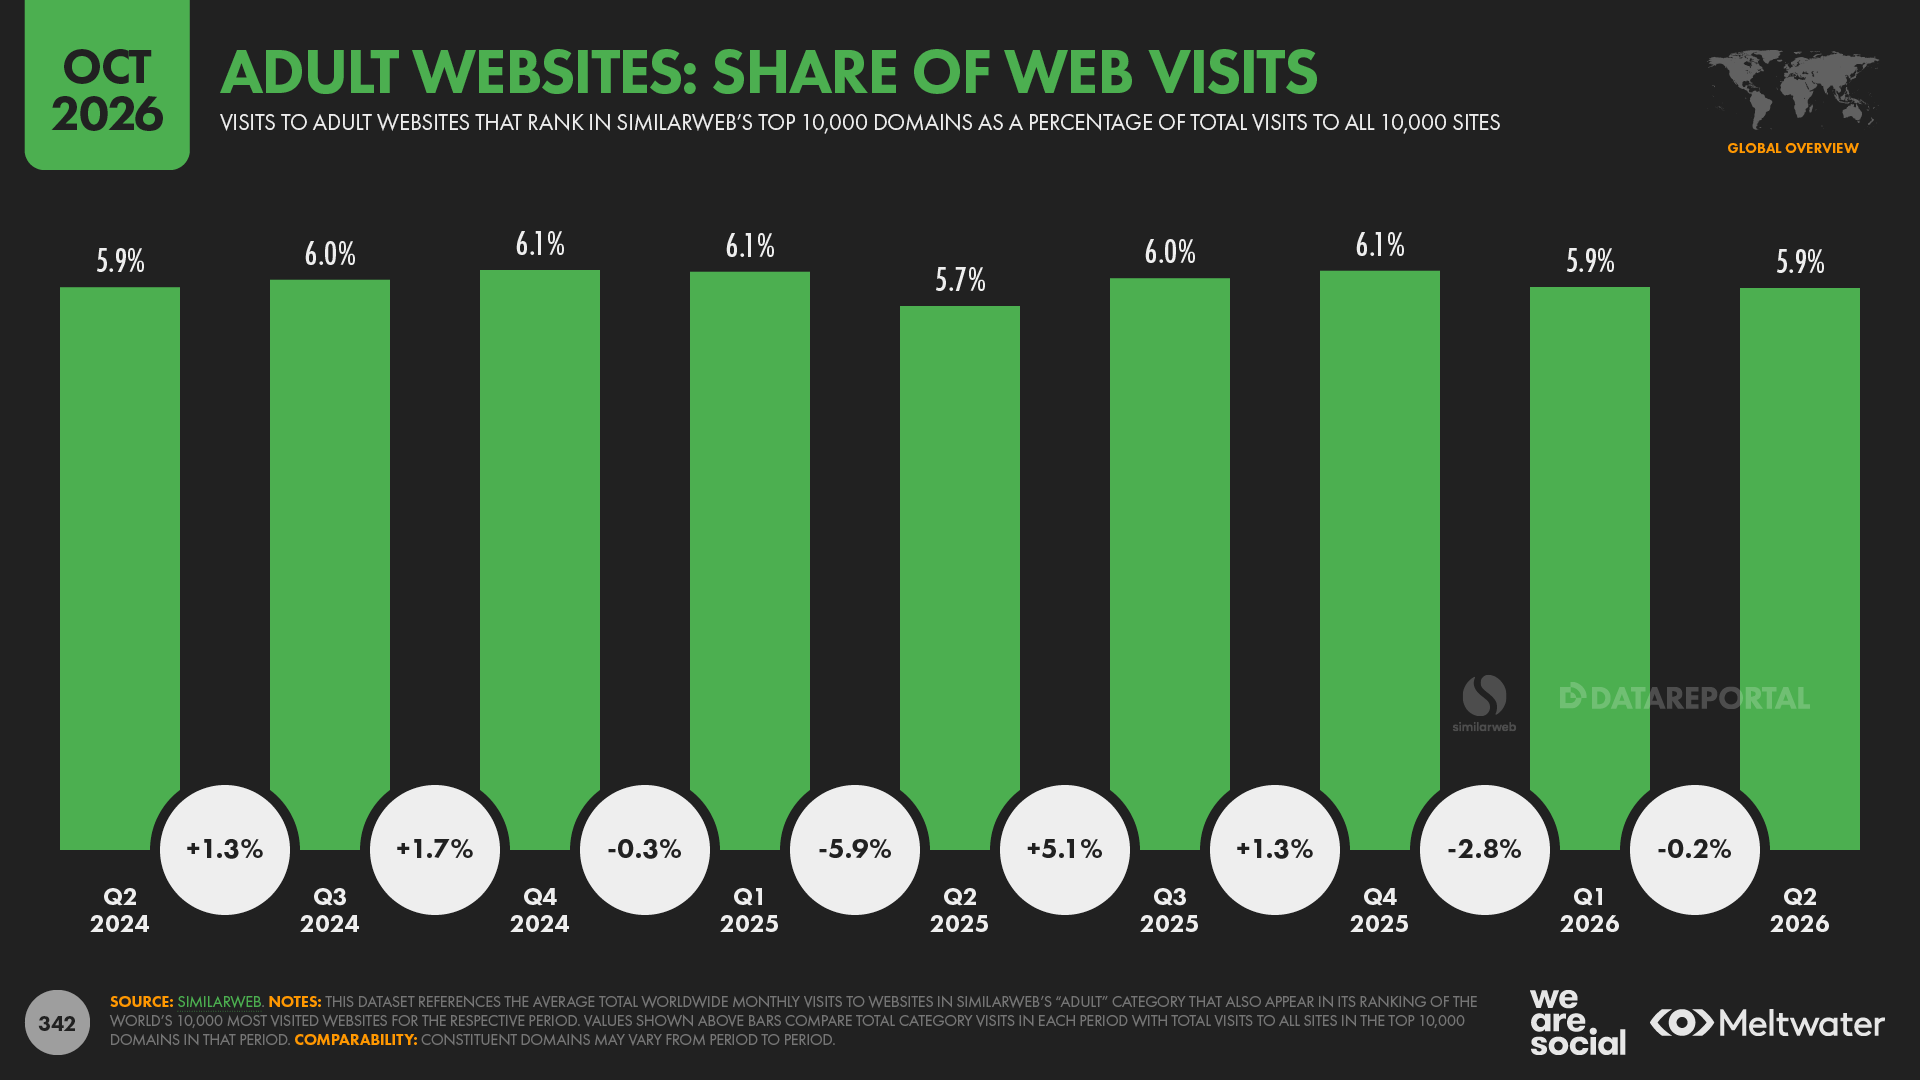
Similarweb’s classification indicates that adult sites accounted for 834 of the sites in the world’s 10,000 most visited domains in Q2 2026, indicating that these sites accounted for more than 8.3 percent of top sites between April and June.
These sites’ share of traffic sits slightly lower, at 5.9 percent, but that still equates to tens of billions of visits every month.
Moreover, “vice” businesses were amongst the first enterprises to monetise the web, and these domains have continued to place highly in the various rankings of the world’s most popular websites that we’ve featured in the 15 years we’ve been producing these Global Digital Reports.
As a result, any substantial change in the popularity of adult sites may offer insights into broader web trends too.
Interestingly, Similarweb’s data shows that total monthly visits to sites in its “adult” category can vary meaningfully from month to month.
Our hypothesis is that these trends are heavily influenced by the perpetual game of cat and mouse that these sites play with the world’s regulators, but even once we allow for such trends, the overall trend points to a steady decline in overall traffic.
Indeed, in the four years since the public launch of ChatGPT, traffic to websites with mature themes has fallen by 12 percent.
And while those monthly fluctuations are clearly visible in more recent data, Similarweb’s data still reveals a 6.9 percent decrease in visits to adult sites over the past 24 months.
So, if traffic declines are affecting even the most commercially successful corners of the web, what might that mean for other businesses?
The commercial web
To explore that question, let’s return to a trend we started exploring in the News and Media section.
Across all content categories, Similarweb’s data reveals that just under a third of websites that ranked amongst the world’s 10,000 most visited domains in Q2 2026 use Google AdSense.
And – somewhat alarmingly – data shows that domains that use advertising products have seen their traffic fall more than twice as quickly as the overall web average.
More specifically, whereas Similarweb’s data puts the average decline in total visits across all of the top 10,000 websites at 6.8 percent over the past two years, the company’s figures suggest that visits to sites that use AdSense have declined by 14.8 percent.
And moreover, if we remove YouTube from Similarweb’s AdSense dataset, that decline accelerates to 18.7 percent, suggesting that sites across the open web that feature advertising may have lost close to 1 in 5 monetisable visits over the past two years.
Moderate increases in average page views per visit have helped to offset this trend, but even then, Similarweb’s data shows that total page views across domains that use AdSense have declined by 8.2 percent over the past two years.
And despite that increase in page views, the total time spent on ad-supported websites appears to have tumbled over recent months.
Indeed, Similarweb’s data indicates that the total, cumulative time spent on websites that use AdSense in Q2 2026 was 21.1 percent lower than the equivalent figure for Q2 2024, equating to the loss of 12½ minutes for every hour that was previously spent on ad-supported domains.
Bad news for brands
For clarity, there is absolutely no indication that the use of advertising products like AdSense might have played a role in declining traffic trends, and our reporting of this data is designed to illustrate the growing financial challenges faced by web publishers in today’s online environment.
But these trends don’t just affect content creators; they also have grave consequences for marketers.
Indeed, Similarweb’s data points to a decline of 35 billion monthly page views across sites that incorporate AdSense over the past two years.
And with most web publishers including more than one AdSense placement on each page, these changes could easily translate to the loss of trillions of ad impressions each year.
And that’s only factoring ad activity on the world’s top 10,000 domains.
A less banner year for display ads?
For additional context, Statista reports that marketers are on track to spend almost US $200 billion on banner ads in 2026, while GWI reports that 22 percent of online adults say that they discover new brands, products, and services through ads on websites.
As a result, this reduction in advertising inventory translates directly to a significant reduction in proven opportunities for marketers.
But the loss of ad inventory is only one way that declines in web activity may affect brands and marketers.
Are brand websites still relevant?
More importantly, might all of these trends mean that marketers should “deprioritise” brand and product websites?
It would be easy to resort to hyperbole and sensationalism here, so let’s look at the data from a few different angles, to reach a balanced conclusion on whether brand websites should still be part of your mix in 2027.
Trends over time
Many of the headlines you’ll see about web trends over the coming months will focus on trends over time, and given the scale and pace of the declines we’ve explored in this article, that’s understandable.
Moreover, in addition to changes in web traffic, GWI’s research suggests that fewer people are turning to brand and product websites during their buyer journeys.
For example, this time two years ago, 26.3 percent of online adults said that they discovered new brands via brand and product websites.
However, in GWI’s most recent wave of research, that figure had fallen to 24.3 percent, with that 1.9 percentage point drop equating to a relative decline of 7.3 percent.
And we see a similar story in GWI’s data for the proportion of online adults who say they visit brand websites to research potential purchases.
In Q2 2024, the reported figure was 34.0 percent, but the value in the Q2 2026 wave of research had fallen to 32.9 percent.
For reference, that 1.1 percentage point decline represents a relative drop of 3.2 percent.
And lastly, in a question exploring the ways in which people choose to interact with brands online, GWI’s data reveals that the number of online adults visiting brand websites has declined from 46.1 percent this time two years ago, to 42.7 percent today.
For context, this decline in self-reported visits to brand websites closely matches the decline we just saw in the number of people who say they discover brands through these resources, with GWI’s data pointing to a relative decrease of 7.4 percent in the past two years.
Absolute realities
However, exploring these trends in isolation delivers a distorted view of the role that brand websites play in people’s lives.
Trends over time are still critically important of course, but GWI’s data also reveals that brand websites remain one of the top six sources of brand discovery.
That’s one place lower than the ranking we saw for brand websites this time two years ago, but almost 1 in 4 online adults still say that they discover new brands, products and services via those entities’ own websites.
And on a relative basis, that’s 43 percent higher than the figure we see for artificial intelligence (AI) tools, which rank fifteenth, on 17 percent.
Perhaps more importantly, however, product and brand websites are the fourth most popular online channel for researching potential purchases, and that rank position has remained steady over the past two years.
And crucially, almost 1 in 3 online adults says that they visit brand and product websites when evaluating potential purchases.
As a result, even if that figure has slipped slightly, brand and product websites clearly still play a central role in people’s decision-making journeys.
Overall, GWI’s respondents are still 27 percent more likely to say that they visit brand websites for product research than they are to say they use artificial intelligence (AI) tools for the same purpose.
However, respondents aged 16 to 24 are now more likely to say they visit AI tools like ChatGPT than they are to visit brands’ own websites when researching potential purchases, and given trends for other age groups, we may see a similar shift across other generations in the next few waves of GWI’s research too.
Considering the broader trends in AI use we’ve explored in our Digital 2027 reports, that shouldn’t come as a surprise, and I fully expect we’ll see the overall balance shift over the next couple of years.
But even when that does happen, brand websites should continue to play an essential role in people’s shopping journeys for many years to come.
And that assertion is borne out by the last dataset for this section, which shows that visiting brand websites is by far the most common type of brand interaction cited by GWI’s worldwide survey base.
Indeed, relatively speaking, online adults are almost 67 percent more likely to say that they’ve visited a brand website in the past month than they are to say that they watched a video made by a brand.
And moreover, despite stereotypes and consistent media misrepresentation, brand websites remain the most common type of brand interaction across all age groups – even for younger generations.
Humans aren’t your website’s only visitors
Across these three datasets, we’ve already already seen clear and compelling evidence that brand websites should remain a primary consideration in the marketing mix for the foreseeable future.
However, it’s important to stress that the data we’ve explored so far fails to consider one of the most important roles that brand websites play today: informing AI models.
Almost every piece of research we’ve examined tells a different story here, but most of those studies concur that brand and product websites are one of the top sources cited by LLMs in response to users’ queries about consumer products and purchases.
In other words, even if we do see the balance of people’s attention and activities shift in favour of AI, brand websites will be just as important as ever, because they remain one of the strongest and most relevant signals in AI training sets.
Conclusions: the outlook for the web
So what have we learned from all this data?
Firstly, based on all the evidence we’ve seen, there’s little doubt that web use is in decline.
However, in light of associated trends like the rise of native web apps, it seems that this trend is more likely the result of changes in how digital content is delivered, rather than a fundamental change in the importance of that content in people’s lives.
These changes still have clear commercial implications though, most notably because they exacerbate the concentration of attention, influence, and economic power amongst an ever smaller group of corporate behemoths.
And furthermore, our analysis indicates that the continued rise of AI will accelerate this consolidation, especially as reductions in visitor traffic starve publishers of vital advertising revenue.
Indeed, the Similarweb data we’ve explored throughout this analysis indicates that these trends have already resulted in a meaningful loss of diversity across the digital landscape.
And research indicates that once consolidation reaches a certain tipping point, it can have more serious consequences:
“Monopolies are generally considered to be bad for consumers and the economy. When markets are dominated by a small number of big players, there’s a danger that these players can abuse their power to increase prices to customers. This kind of excessive market power can also lead to less innovation, losses in quality, and higher inflation.”
So, while changes in content delivery may not have diminished the importance of digital content and information in people’s lives, there’s a real risk that these trends will result in a meaningful reduction in the quality and variety of that content.
Counterarguments
However, the same researchers also note that – provided markets don’t become dominated by a single monopoly – the case against conglomerates and oligopolies may be more nuanced than traditional economic theory suggests.
Meanwhile, current trends suggest that AI tools will fundamentally change how we produce, access, and consume content, and – while we will almost certainly lose certain things along the way – such evolution may deliver greater benefits than the status quo.
Somewhat ironically, much of this reminds me of the situation we saw three decades ago with the rise of the web, and concerns and debates relating to AI have many apparent parallels with concerns and debates about the potential impact of the web that circulated back in the 1990s.
But if we look at how the world has changed in the 35 years since the advent of the web, two things stand out:
The continued advance of technology seems almost as inevitable as death and taxes; and
The innovations that have the greatest impact on our lives are rarely the ones we see coming
Optimising your to-do list
As a result, instead of attempting to predict the future, my counsel would be to invest in building processes and systems that are capable of adapting quickly and efficiently to whatever changes the future may bring.
Crucially, we must also accept that even the most impressive technological advances will eventually be surpassed.
That seems to be the inevitable price of progress.
I will be forever grateful to Tim Berners-Lee for his gift to the world, and the web will always have a special place in my heart.
But I’m also excited for what’s next, and I’m looking forward to exploring that future with you.
Disclosure: Simon Kemp is a brand ambassador for GWI.
Click here to see all of Simon’s articles, read his bio, and connect with him on social media.